
iThera MSOT
Here is a sample of photoacoustic images from the Small Animal Imaging Resource (UT-SAIR) at UT Southwestern.
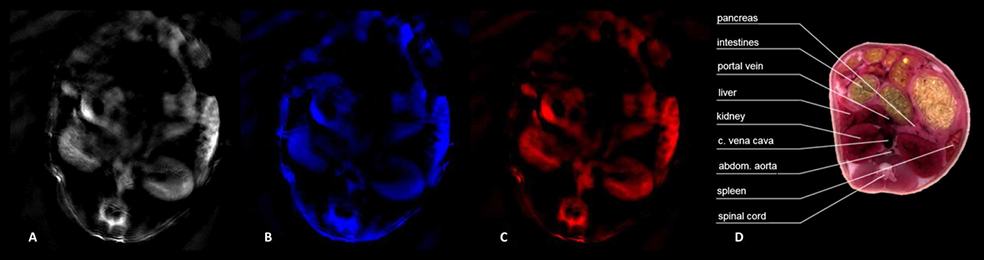
Transaxial cross-sectional PAT images of nude mouse. A. Background (single wavelength: 850 nm). B. Deoxy-Hb map. C. Oxy-Hb from map. D. Reference Atlas from MSOT system. (Presented at “Exploring a fluorescent blood pool agent in photoacoustic imaging” H. Zhou, J. Campbell, D. O'Kelly, J. Gerberich, R. P. Mason, SNMMI San Diego, June 2016 (J. Nucl. Med., 57 (supplement 2), 1214)
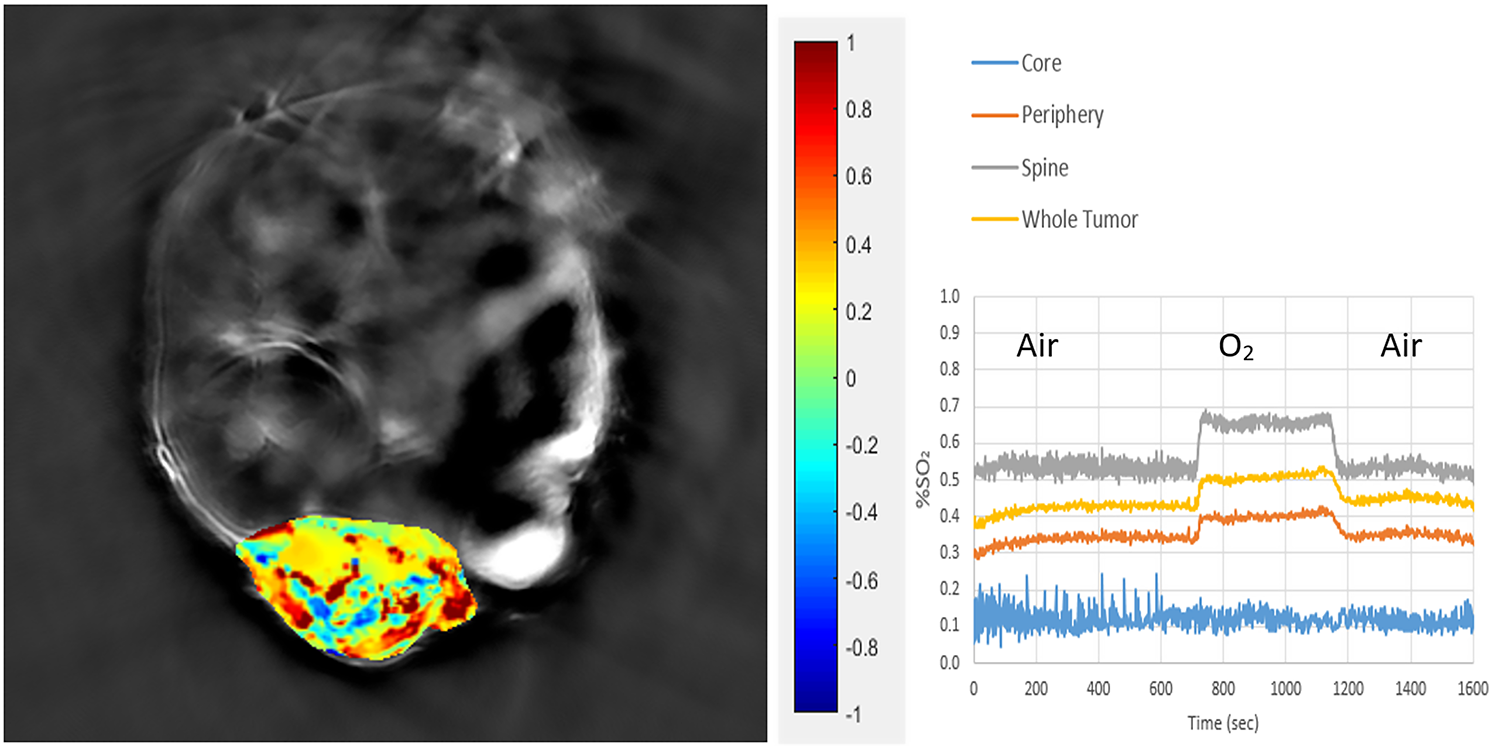
Transaxial image through mouse with MDA-MB-231 tumor in mammary fat pad. Heat map shows response to oxygen gas breathing challenge. Regions of interest were selected to show vascular oxygen saturation with respect to an O2-breathing challenge. Data from Devin O’Kelly supported by CPRIT (RP 140399) in collaboration with Dr. Kevin Pinney of Baylor University.
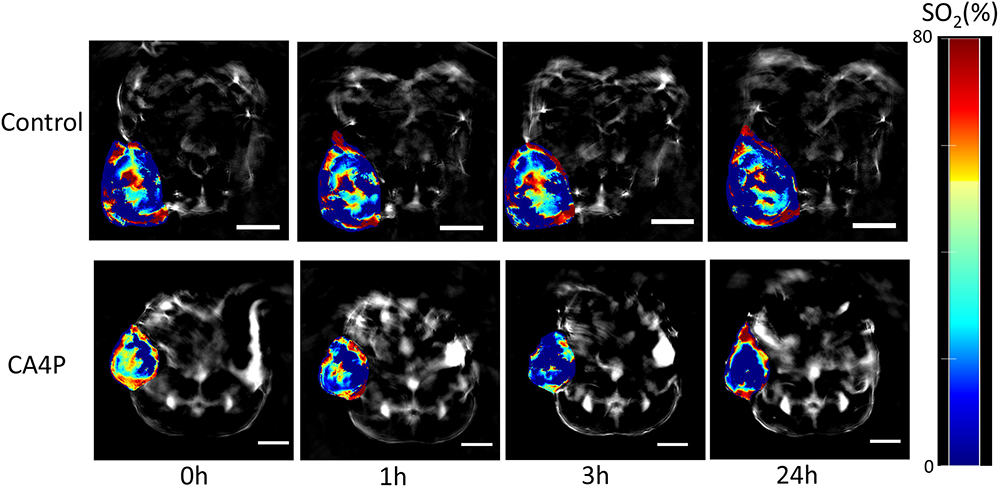
MSOT images of lung xenograft tumor at different time points (0, 1, 3 and 24 hrs) post-saline (control) or CA4P (120 mg/kg, IP) administration. Red color corresponds to higher concentration of oxyhemoglobin and blue color represents either higher concentration of deoxyhemoglobin or an area where there is no blood present. Percentage of hemoglobin saturation (%SO2) was calculated as %SO2 = [HbO2/(HbO2+Hb)]*100. Adapted from “The vascular disrupting agent combretastatin A-4 phosphate causes prolonged elevation of proteins involved in heme flux and function in resistant tumor cells”, S. Dey, S. Kumari, S. P. Kalainayakan, J. Campbell III, P. Ghosh, H. Zhou, K. E. FitzGerald, M. Li, R. P. Mason, L. Zhang, L. Liu, Oncotarget, 2017
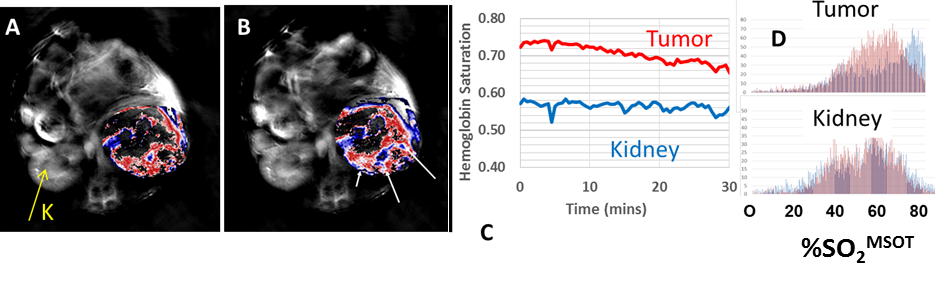
MSOT of a PDX model RCC. A) Transaxial MSOT image of a nude mouse bearing an RCC xenograft in subrenal capsule; approximate SO2MSOT map (color) overlaid on single-wavelength image (gray). Clear intratumoral heterogeneity is seen, and the contralateral kidney is visible (K). B) The same tumor 30 mins after intraperitoneal injection of vascular disrupting agent (120 mg/kg CA4P). Substantial decrease in oxygenation can be seen in several locations (white arrows). C) Dynamic time course of approximate SO2MSOT in both tumor and kidney in response to a pre-scan injection of CA4P. Tumor responds, but normal tissue (kidney) shows little decrease in saturation. D) Histograms of SO2MSOT at 0 mins (blue) and 30 mins (red), illustrating substantial changes in hemodynamics in tumor tissue which are not seen in kidney. Sponsored by P50CA196516 in collaboration with Dr. James Brugarolas.
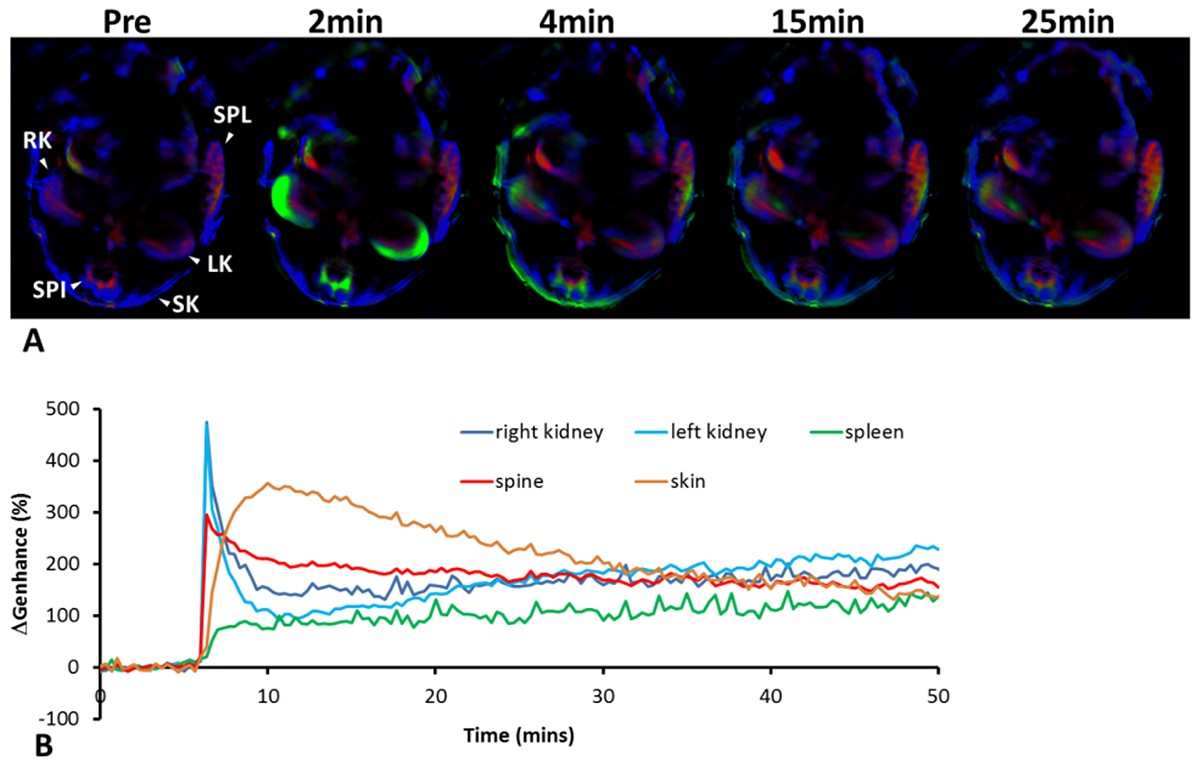
Photoacoustic assessment of healthy nude mouse after injection of a fluorescent blood pool imaging agent. Multispectral analysis results showing various anatomical structures before and after injection. Oxy- (Red), deoxyhemoglobin (Blue) and fluorescent agent (Green) maps were overlaid. Organs of interest are indicated with arrow heads in the first images (RK- right kidney; LK- left kidney; SPL- spleen; SPI- spine; SK- skin). B. Normalized intensity curves of fluorescent agent concentration obtained for various organs Presented at SNMMI San Diego, June 2016.
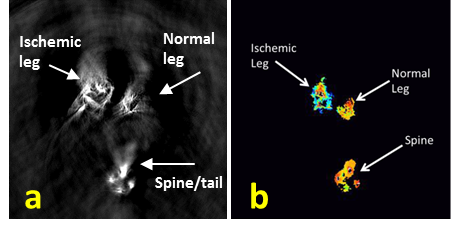
MSOT observation of vascular response to dynamic oxygen breathing challenge. a) Transaxial view of a single slice including clamped and normal legs as well as tail (where 4 blood vessels are clearly seen) at level of the thigh. b) Derived oxygen saturation maps from spectral unmixing. Data acquired by Trey Campbell.