Photo Gallery
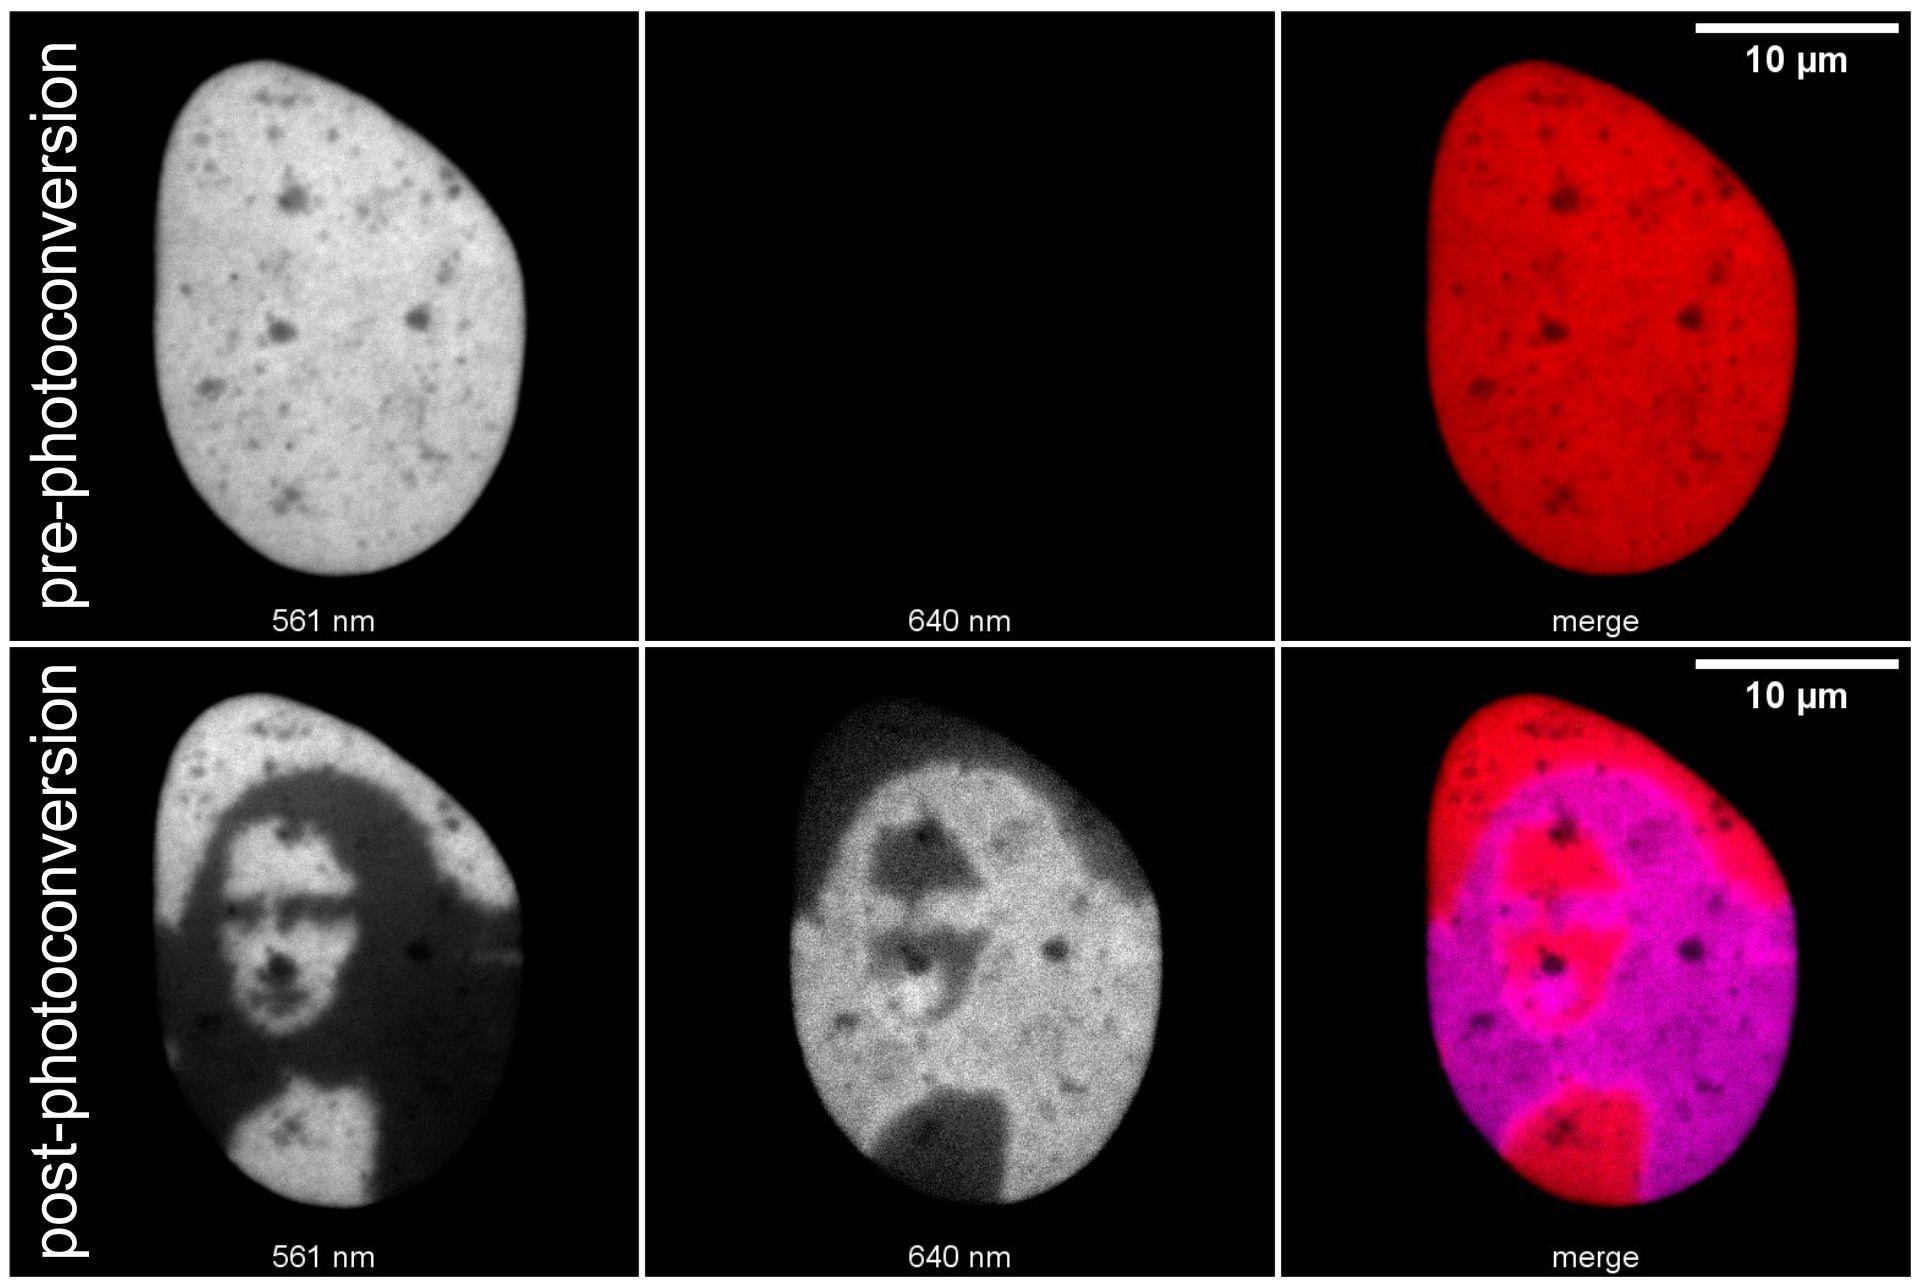
Cells expressing H2B-PSmOrange
Live cells expressing H2B-PSmOrange were used to photoconvert PSmOrange from red into far red, using a binarized image of the Mona Lisa. Although not scientific, this image highlights the capabilities and precision of modern microscopes. The image was acquired on a Nikon spinning disk confocal with FRAP module. Objective: 100x/1.45 NA. Etai Saponzik, Fiolka lab, kindly provided cells.
Live cells expressing H2B-PSmOrange were used to photoconvert PSmOrange from red into far red, using a binarized image of the Mona Lisa. Although not scientific, this image highlights the capabilities and precision of modern microscopes. The image was acquired on a Nikon spinning disk confocal with FRAP module. Objective: 100x/1.45 NA. Etai Saponzik, Fiolka lab, kindly provided cells.
RPE-1 cells were imaged every 6 seconds for 10 minues a Tomocube HT-X1 Plus in holotomographic mode. Only a cropped area from the bottom slice of the entire volume is shown to highlight membrane ruffling. Cells were kindly provided by Lizz Maurais – Ly lab, @UTSW.
U2OS cells were imaged for 48hrs in a Tomocube HT-X1 Plus in both holotomographic and bright field mode, followed by segmentation with Fiji Cellpose-SAM.0.2.
An artificial 3D matrix populated with cells was imaged with a Nikon CSU-W1 spinning disk confocal and volume was rendered with Imaris 10.2.
Click image to view full version
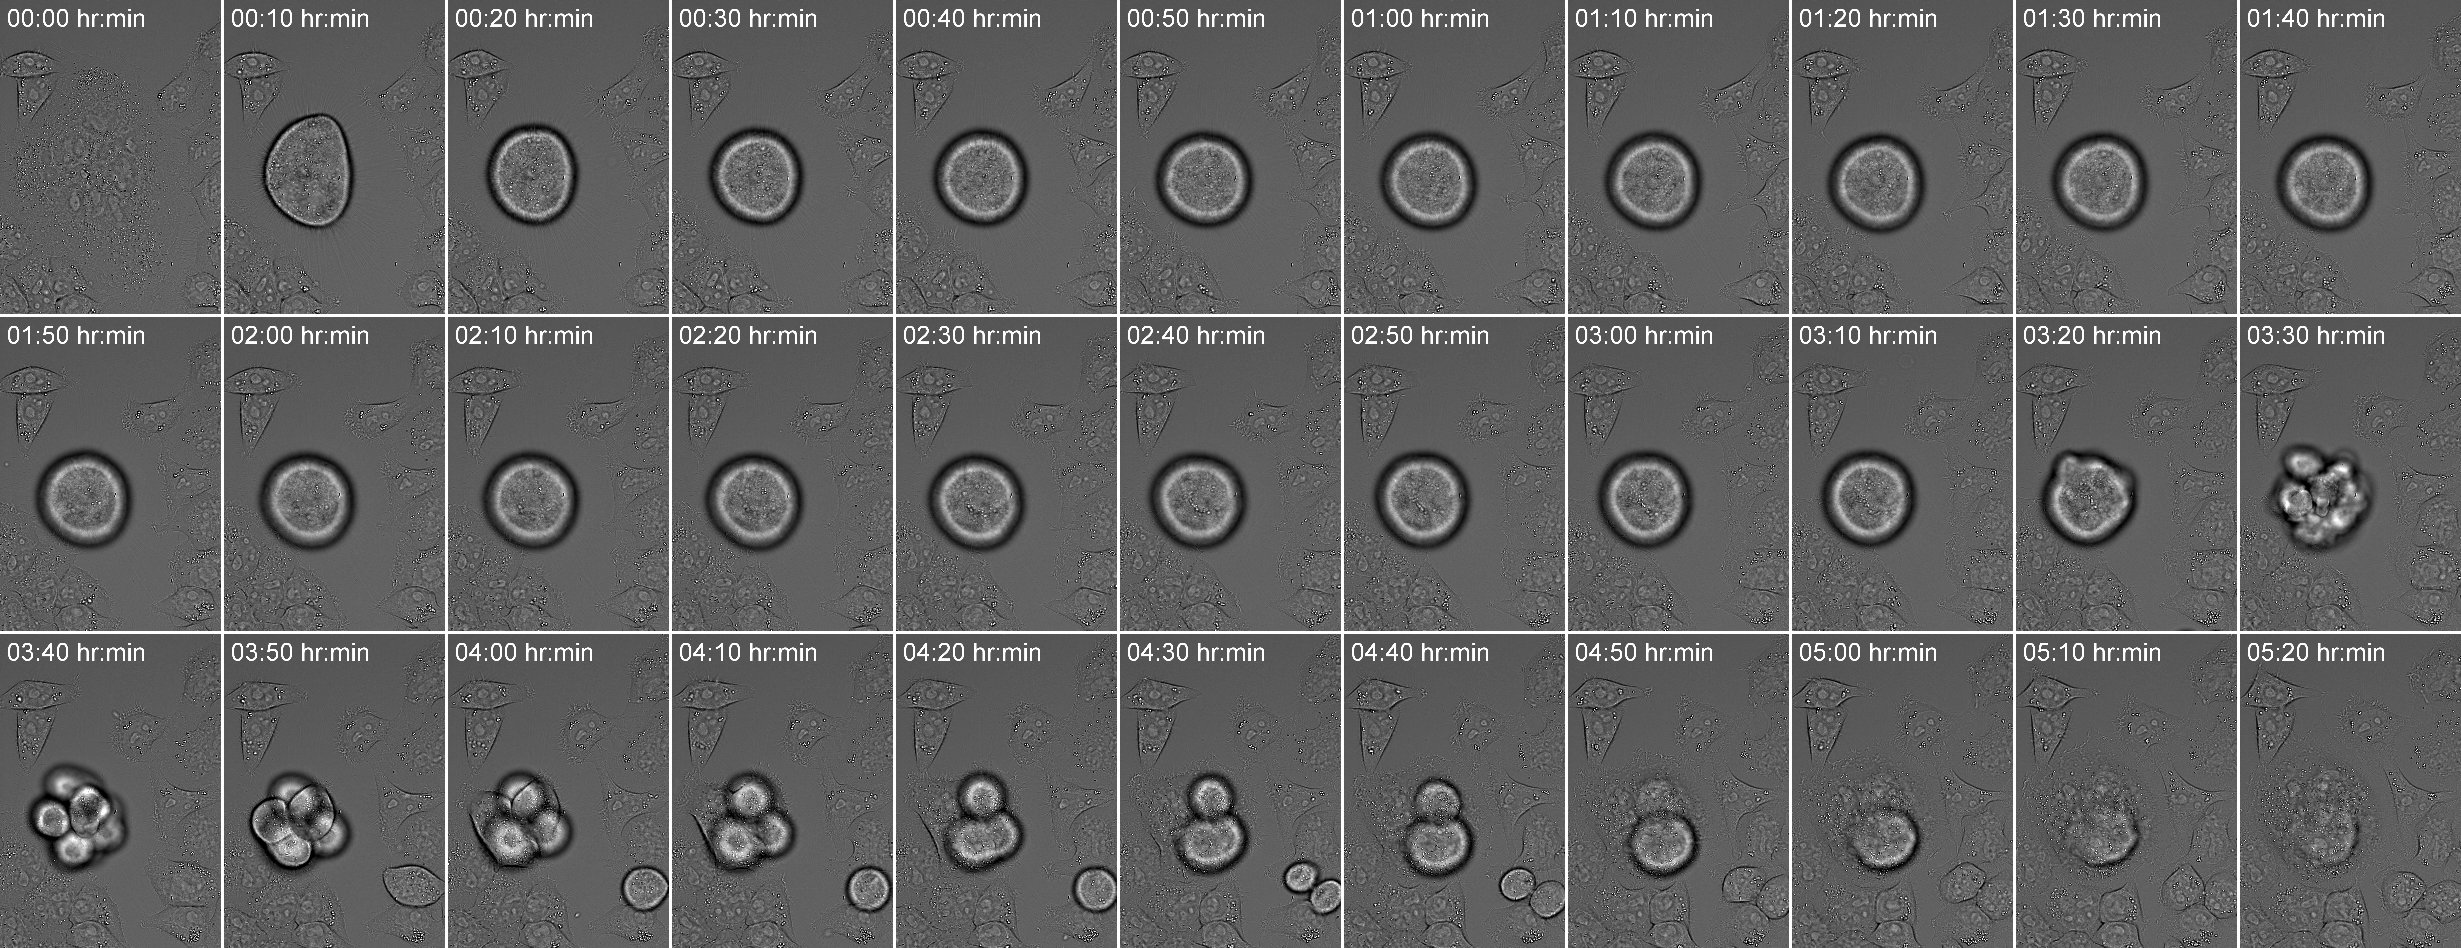
Yet another failed cell division
HeLa cells plated in a glass-bottom dish were imaged for 36 hrs on the Tomocube HT-X1 Plus. A sub-stack of brightfield images shows another failed division of a multinucleated HeLa cell. Imaged by Marcel Mettlen.
HeLa cells plated in a glass-bottom dish were imaged for 36 hrs on the Tomocube HT-X1 Plus. A sub-stack of brightfield images shows another failed division of a multinucleated HeLa cell. Imaged by Marcel Mettlen.
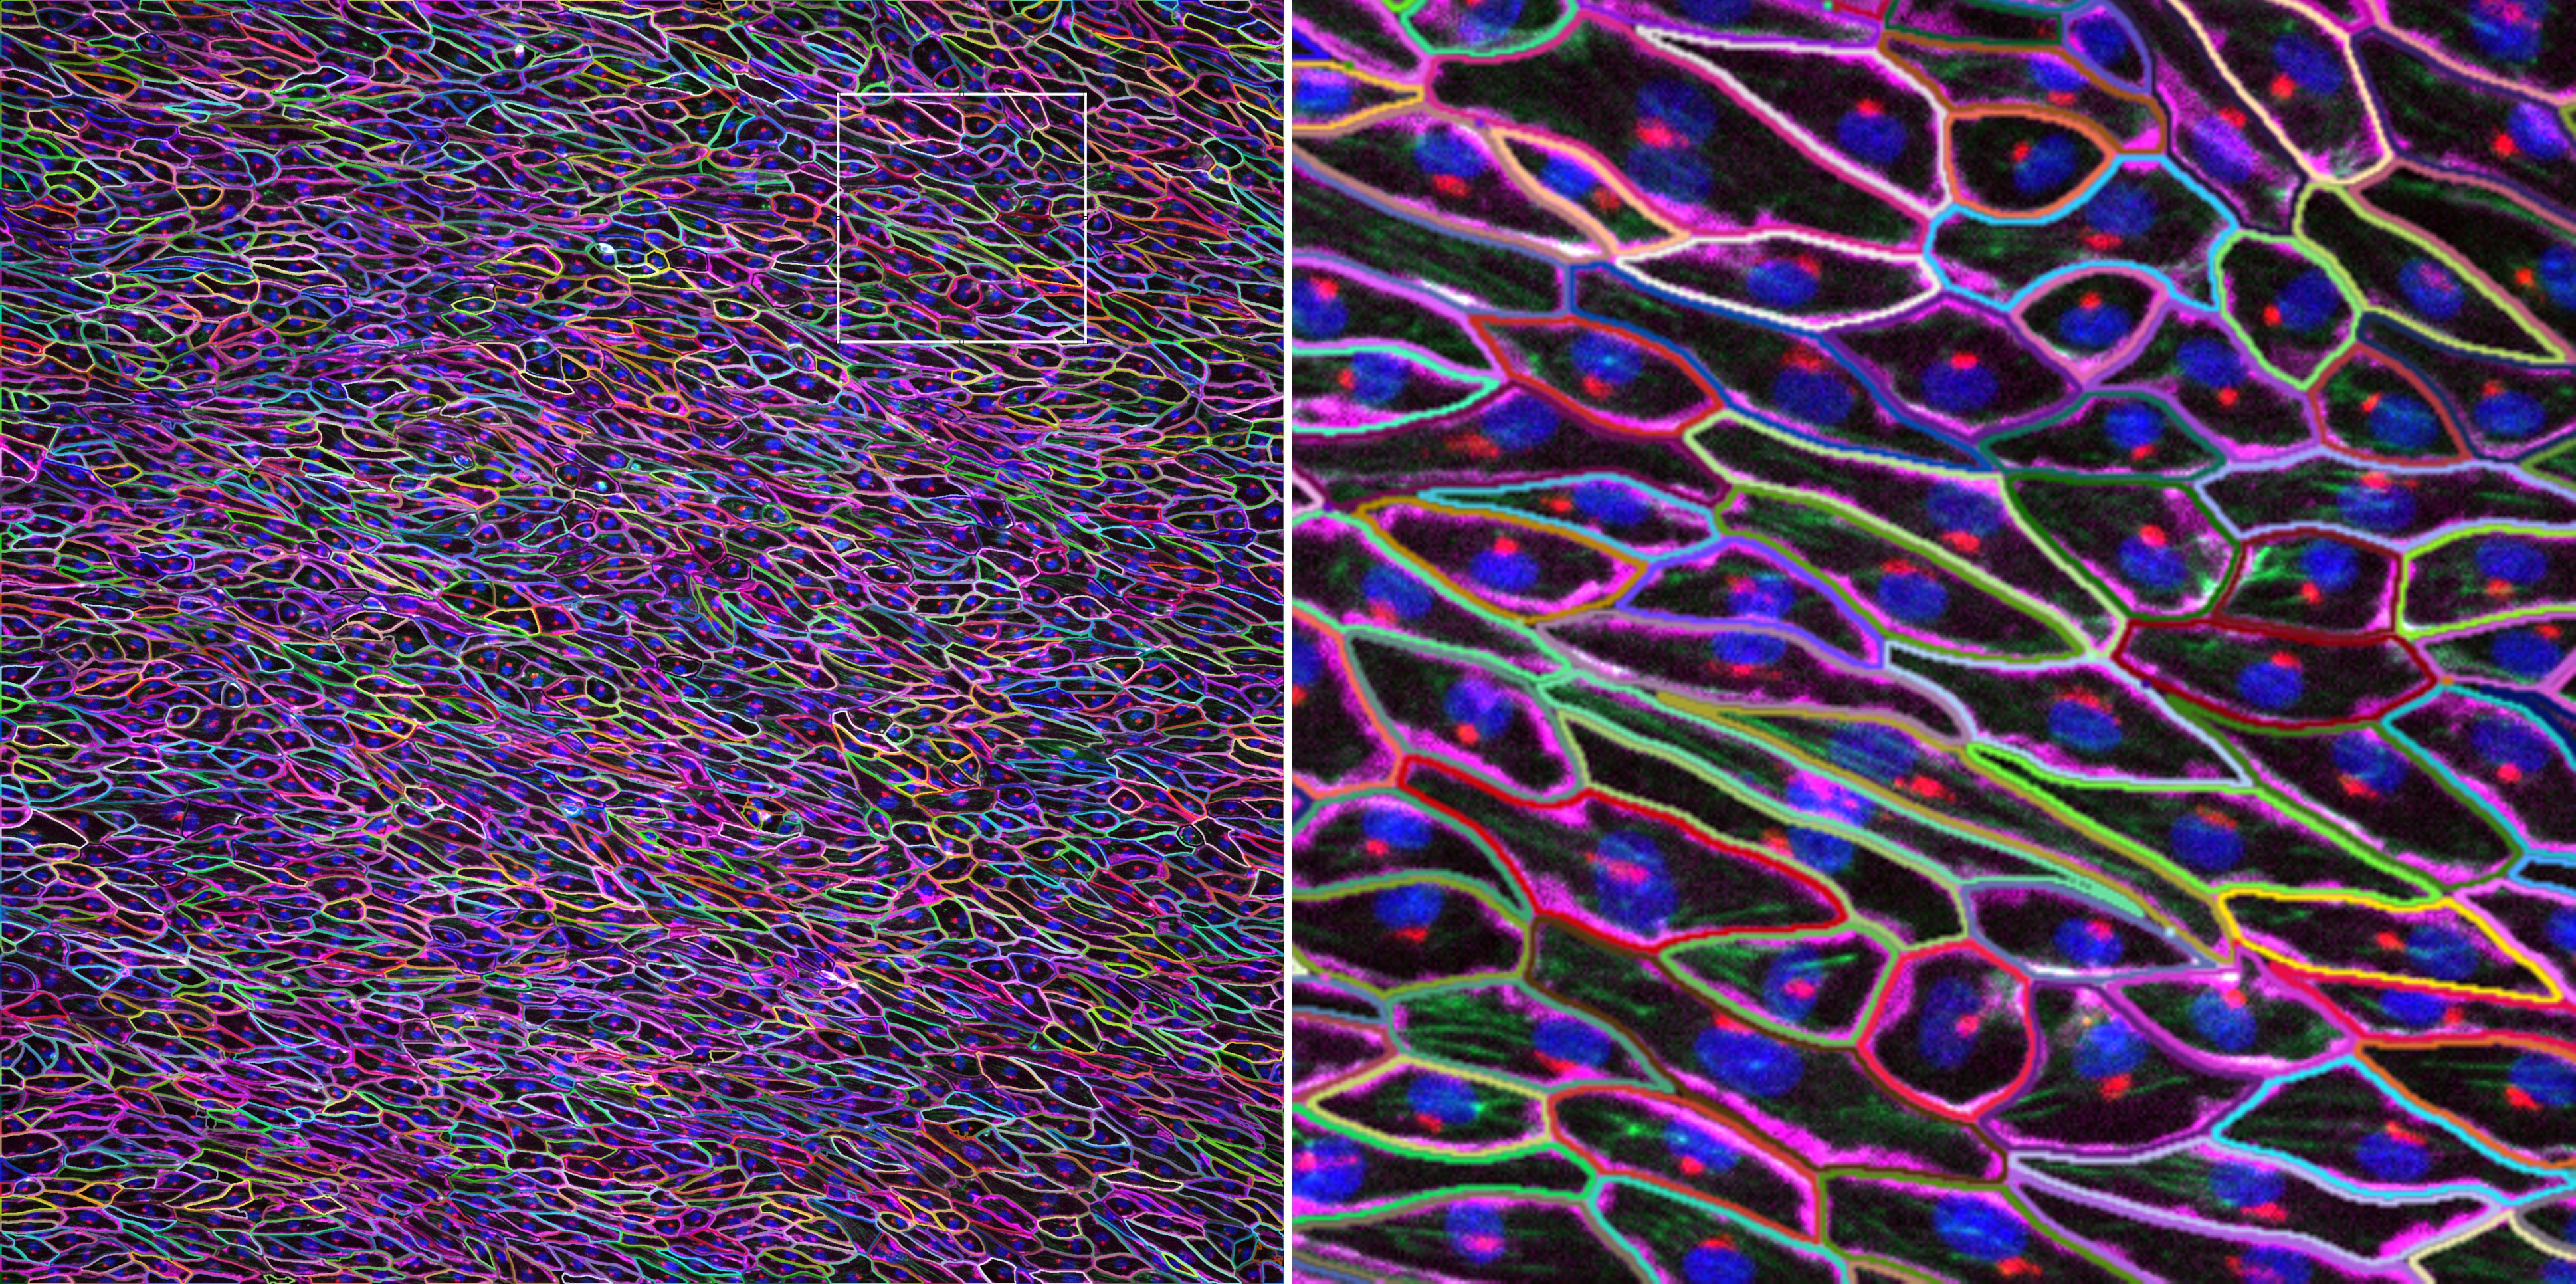
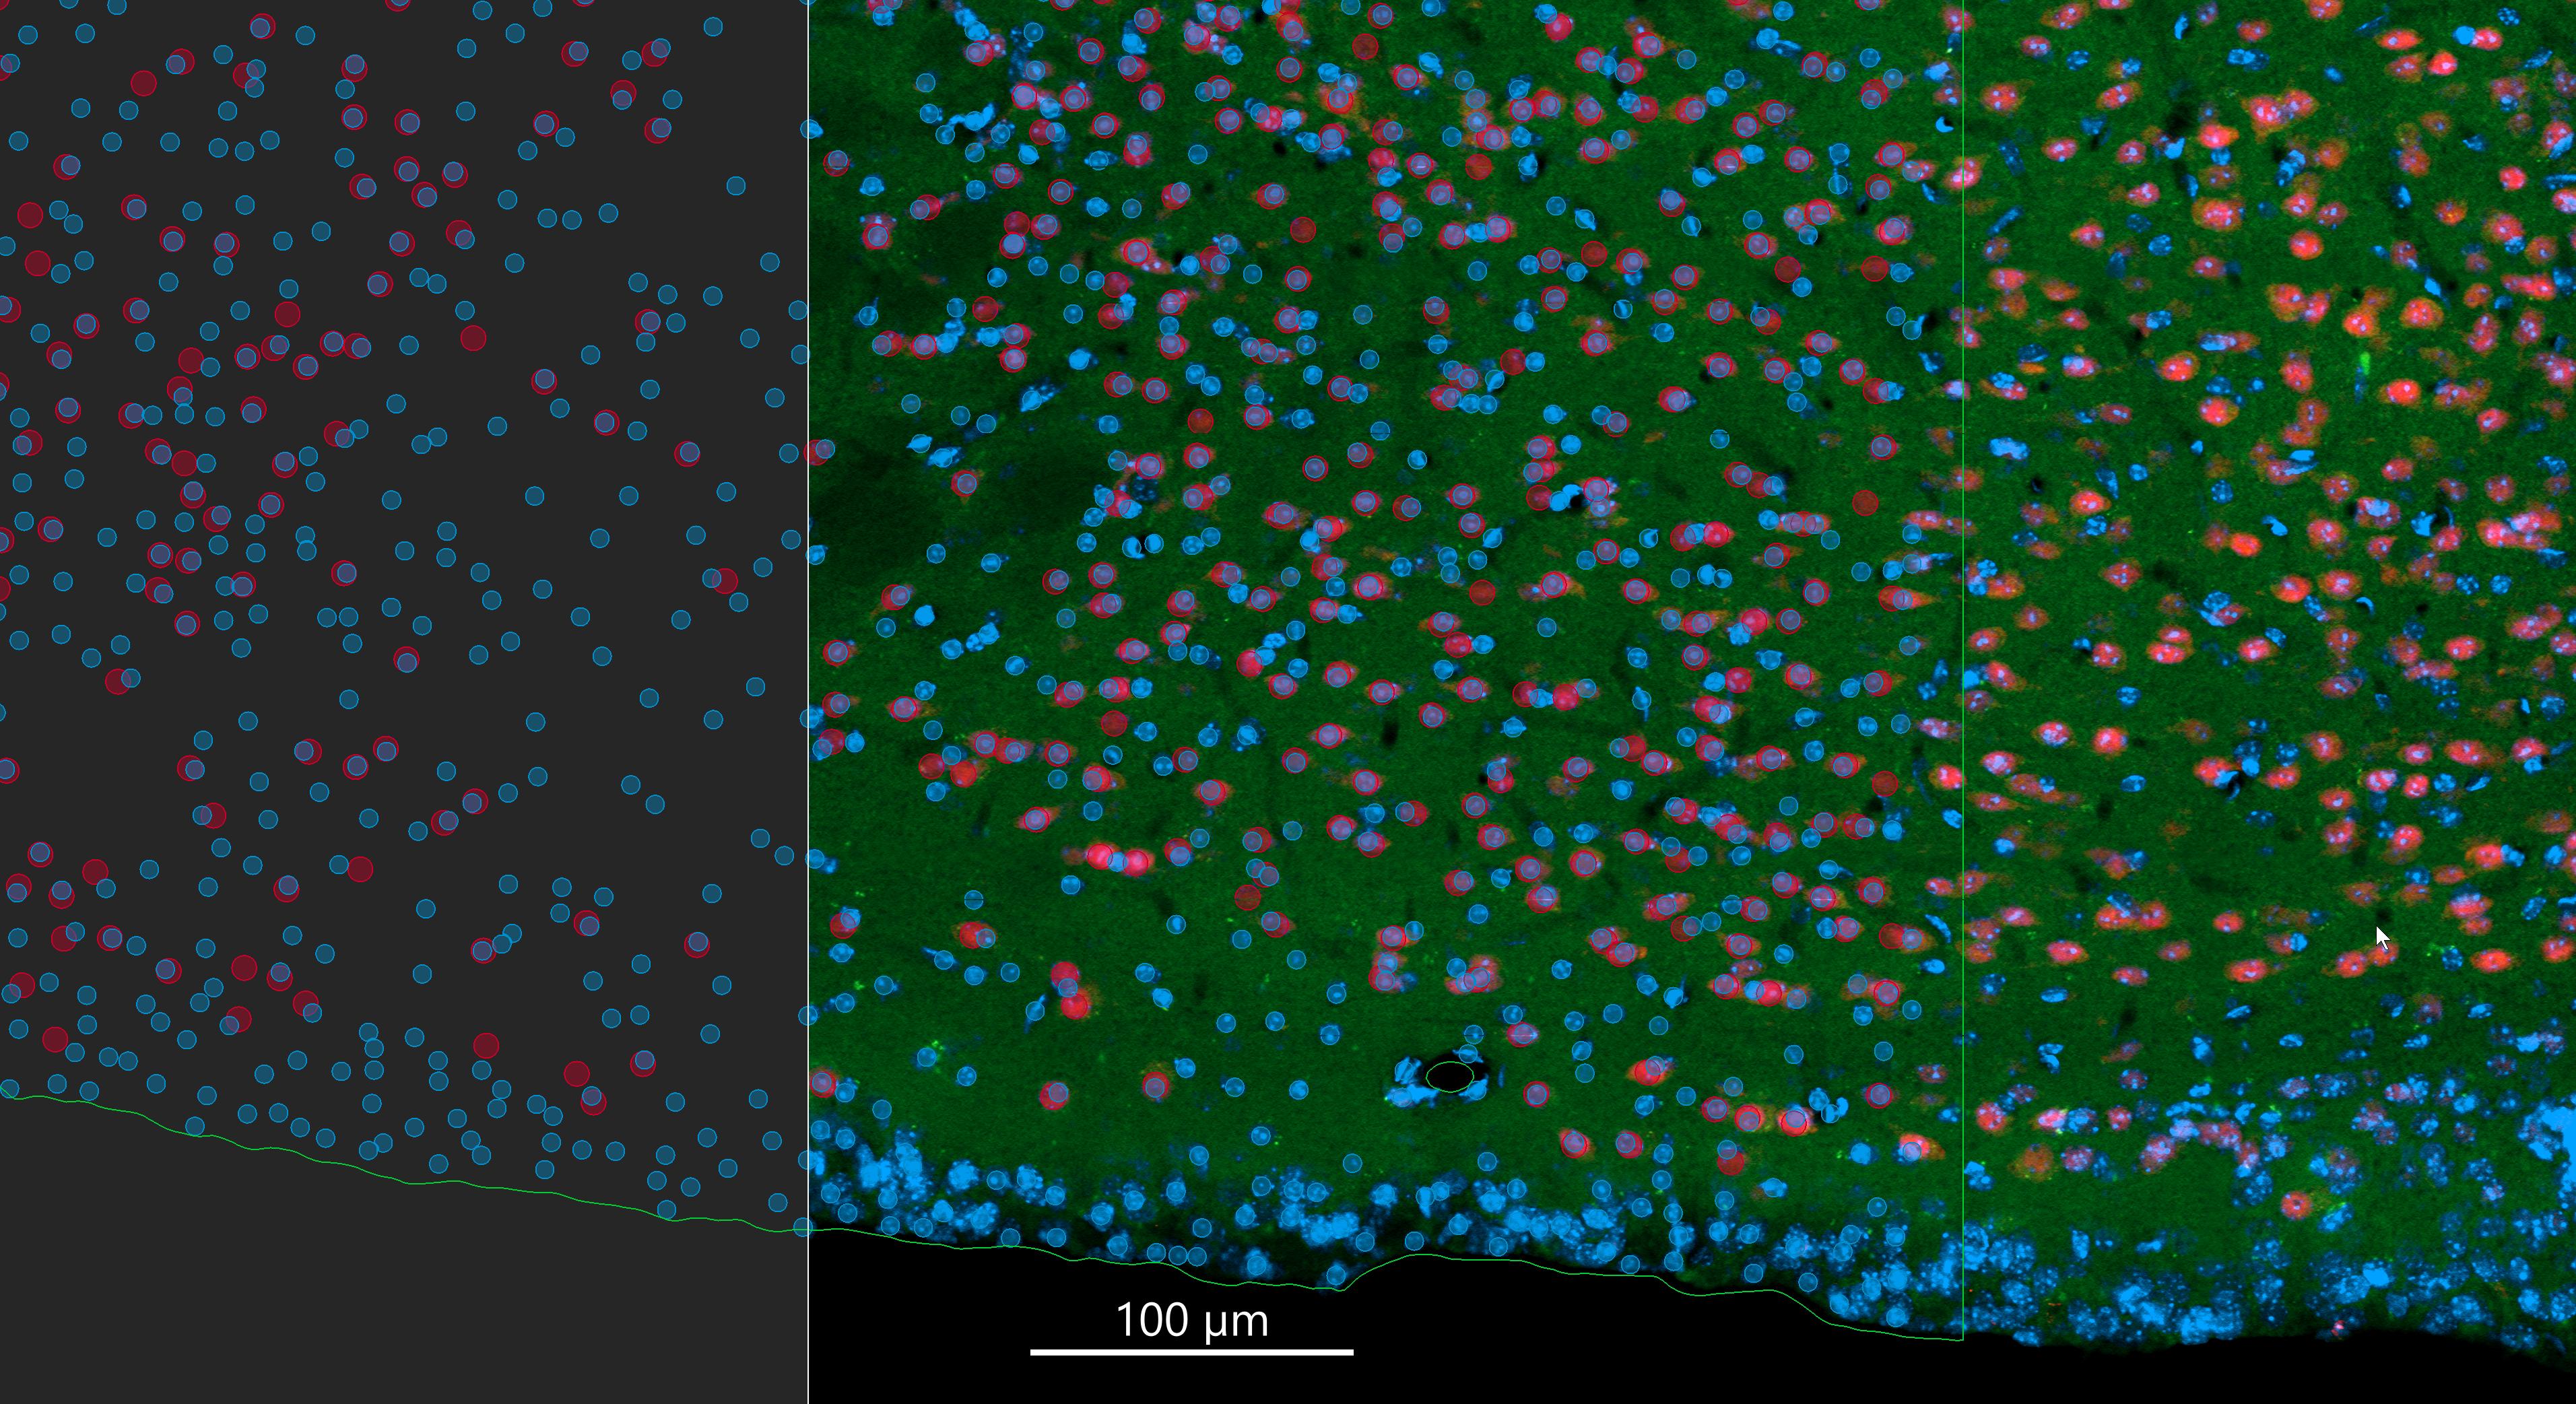
Fiji-based image segmentation
Cells were stained for plasma membrane (CDH5/VE-cadherin, magenta), Golgi (red), actin (green), and nuclei (blue). Imaged on a Nikon CSU-W1 spinning disk confocal microscope using a 10x/0.45 NA objective. Samples were prepared and imaged by Steve Spurgin. Image analysis by Marcel Mettlen.
Cells were stained for plasma membrane (CDH5/VE-cadherin, magenta), Golgi (red), actin (green), and nuclei (blue). Imaged on a Nikon CSU-W1 spinning disk confocal microscope using a 10x/0.45 NA objective. Samples were prepared and imaged by Steve Spurgin. Image analysis by Marcel Mettlen.
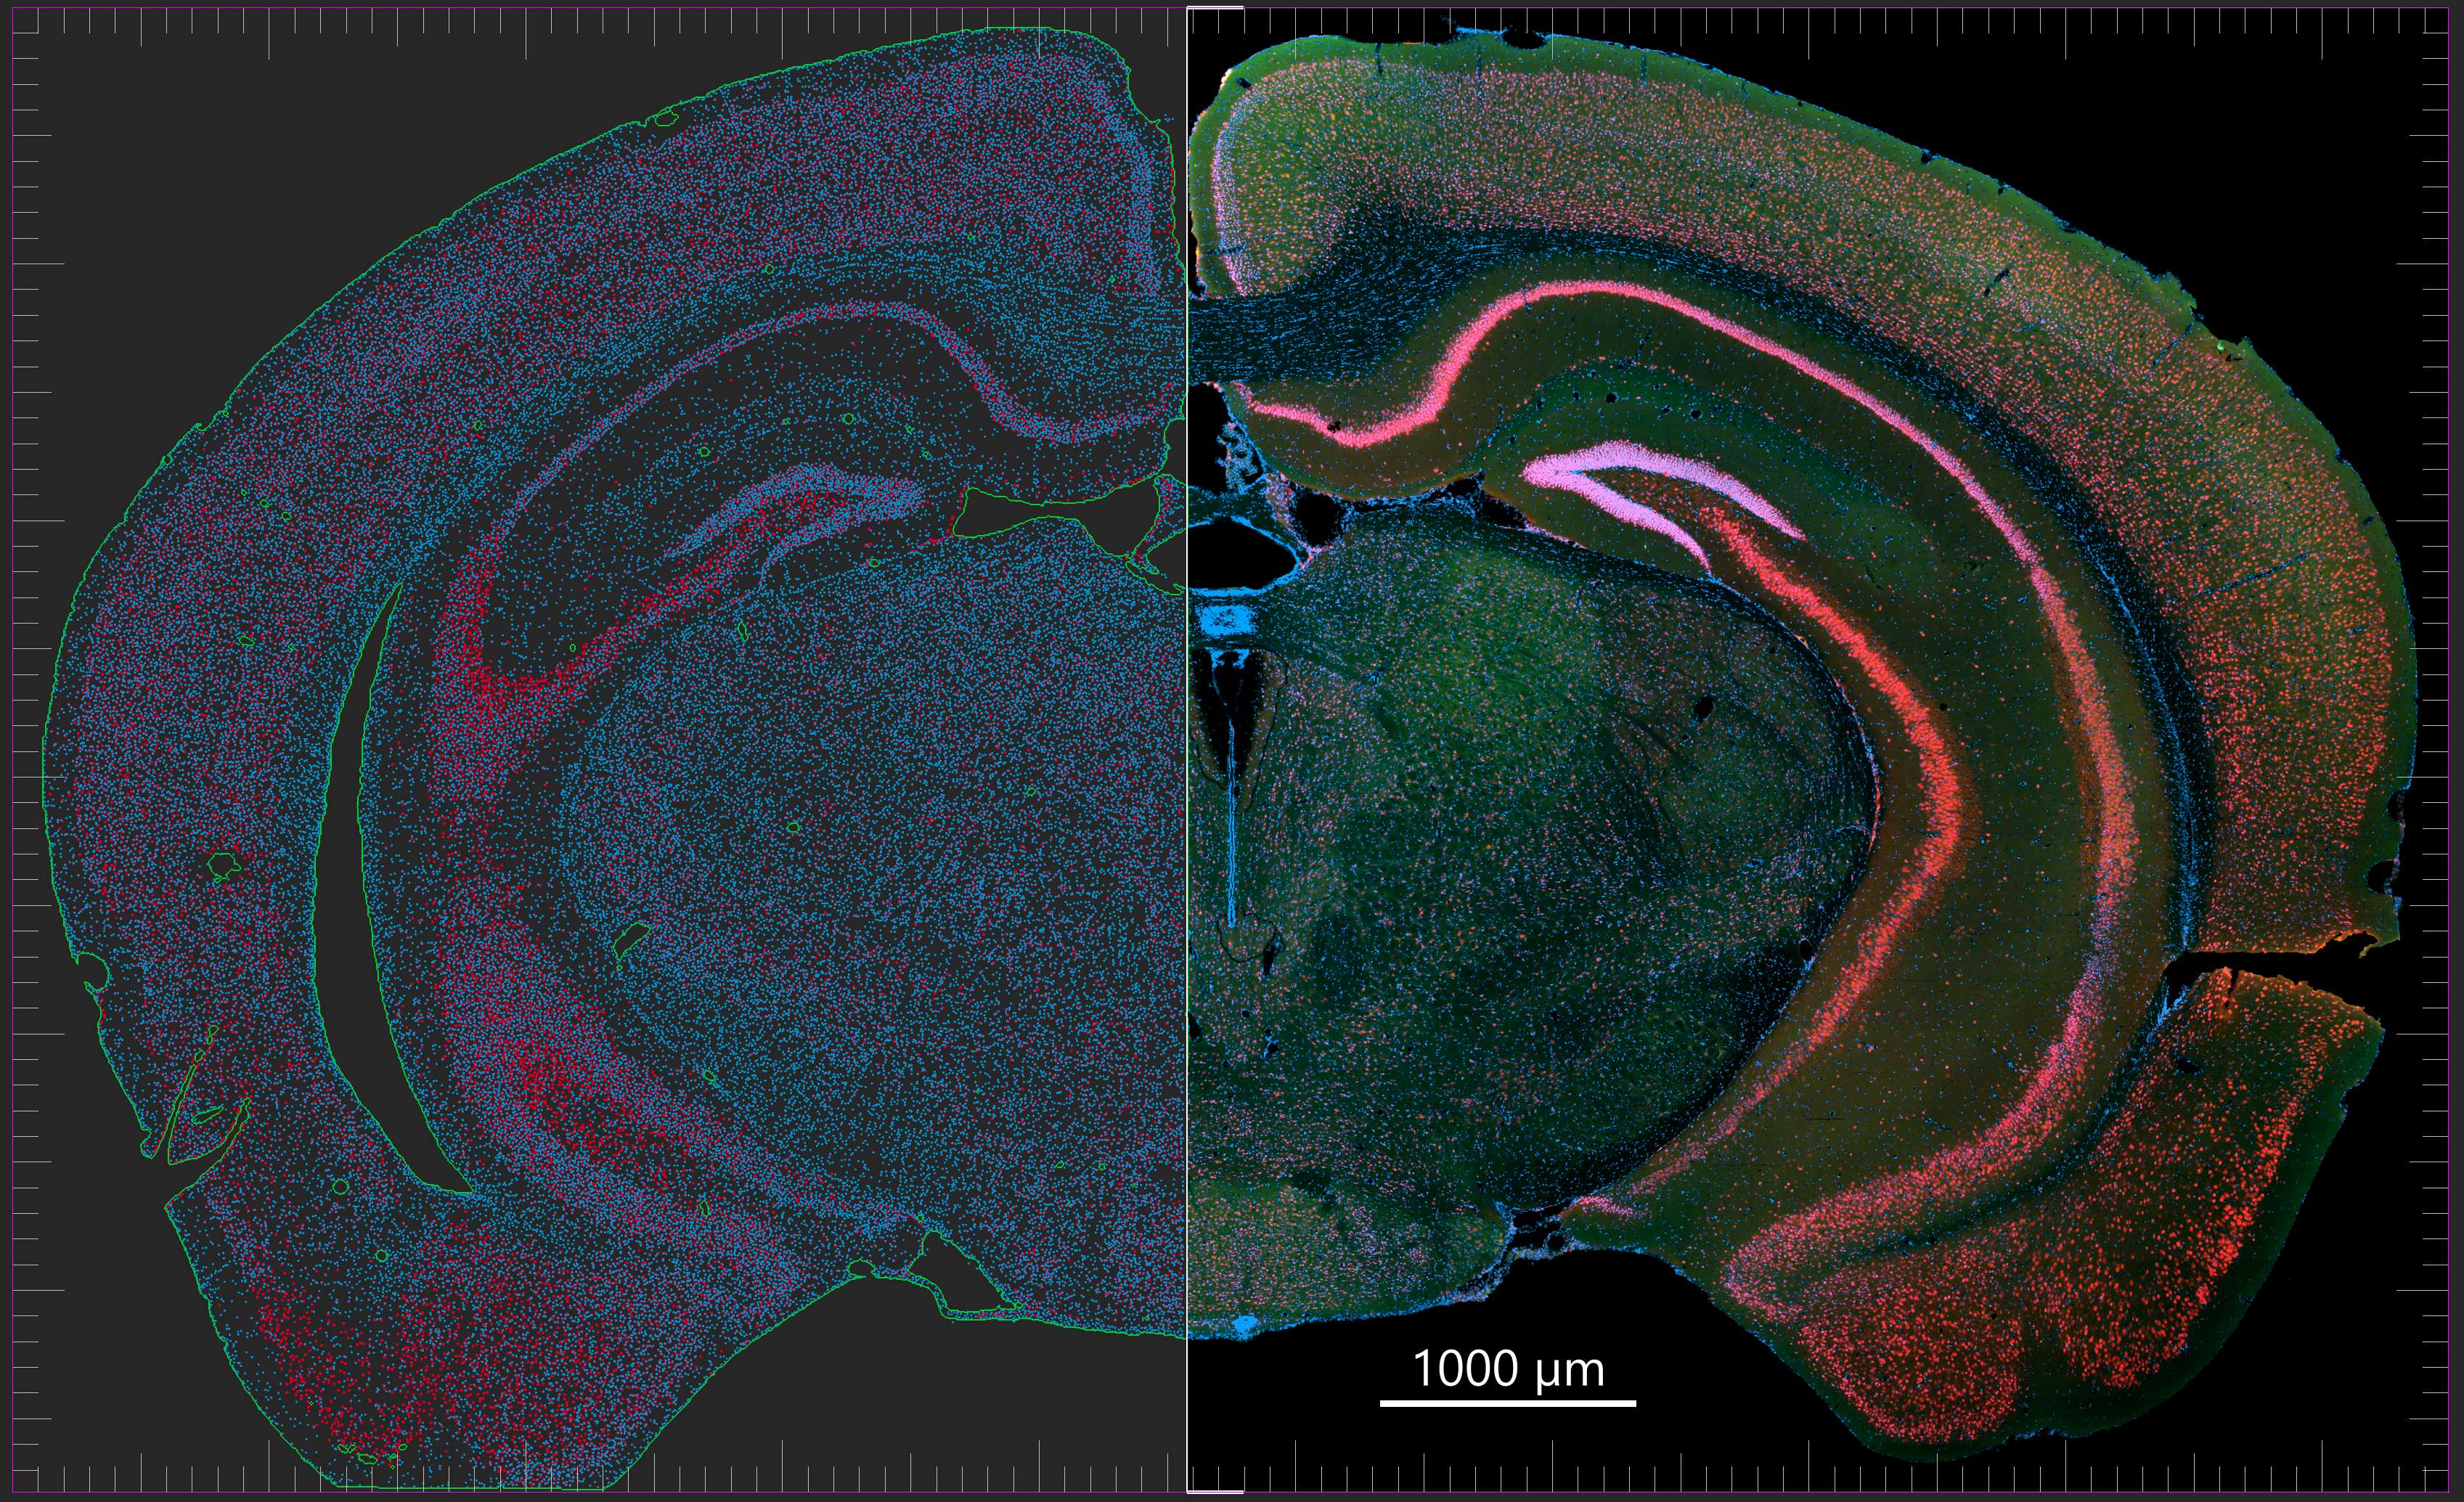
Rendering of frontal mouse brain section
Mouse brain frontal section imaged on a Zeiss LSM 980 with Airyscan 2 and AI Sample Finder. Objective: Plan-Apochromat 25x/0.8 oil immersion. Dataset: 735 stitched tiles; pixel size 0.124 × 0.124 µm; image dimensions 76,822 × 46,842 px; total pixels ~3.6 billion; scan time ~40 min; file size ~27 GB. Image rendered in Imaris 10.2.0. Credit: Chad Smith, Monson Lab.
Mouse brain frontal section imaged on a Zeiss LSM 980 with Airyscan 2 and AI Sample Finder. Objective: Plan-Apochromat 25x/0.8 oil immersion. Dataset: 735 stitched tiles; pixel size 0.124 × 0.124 µm; image dimensions 76,822 × 46,842 px; total pixels ~3.6 billion; scan time ~40 min; file size ~27 GB. Image rendered in Imaris 10.2.0. Credit: Chad Smith, Monson Lab.
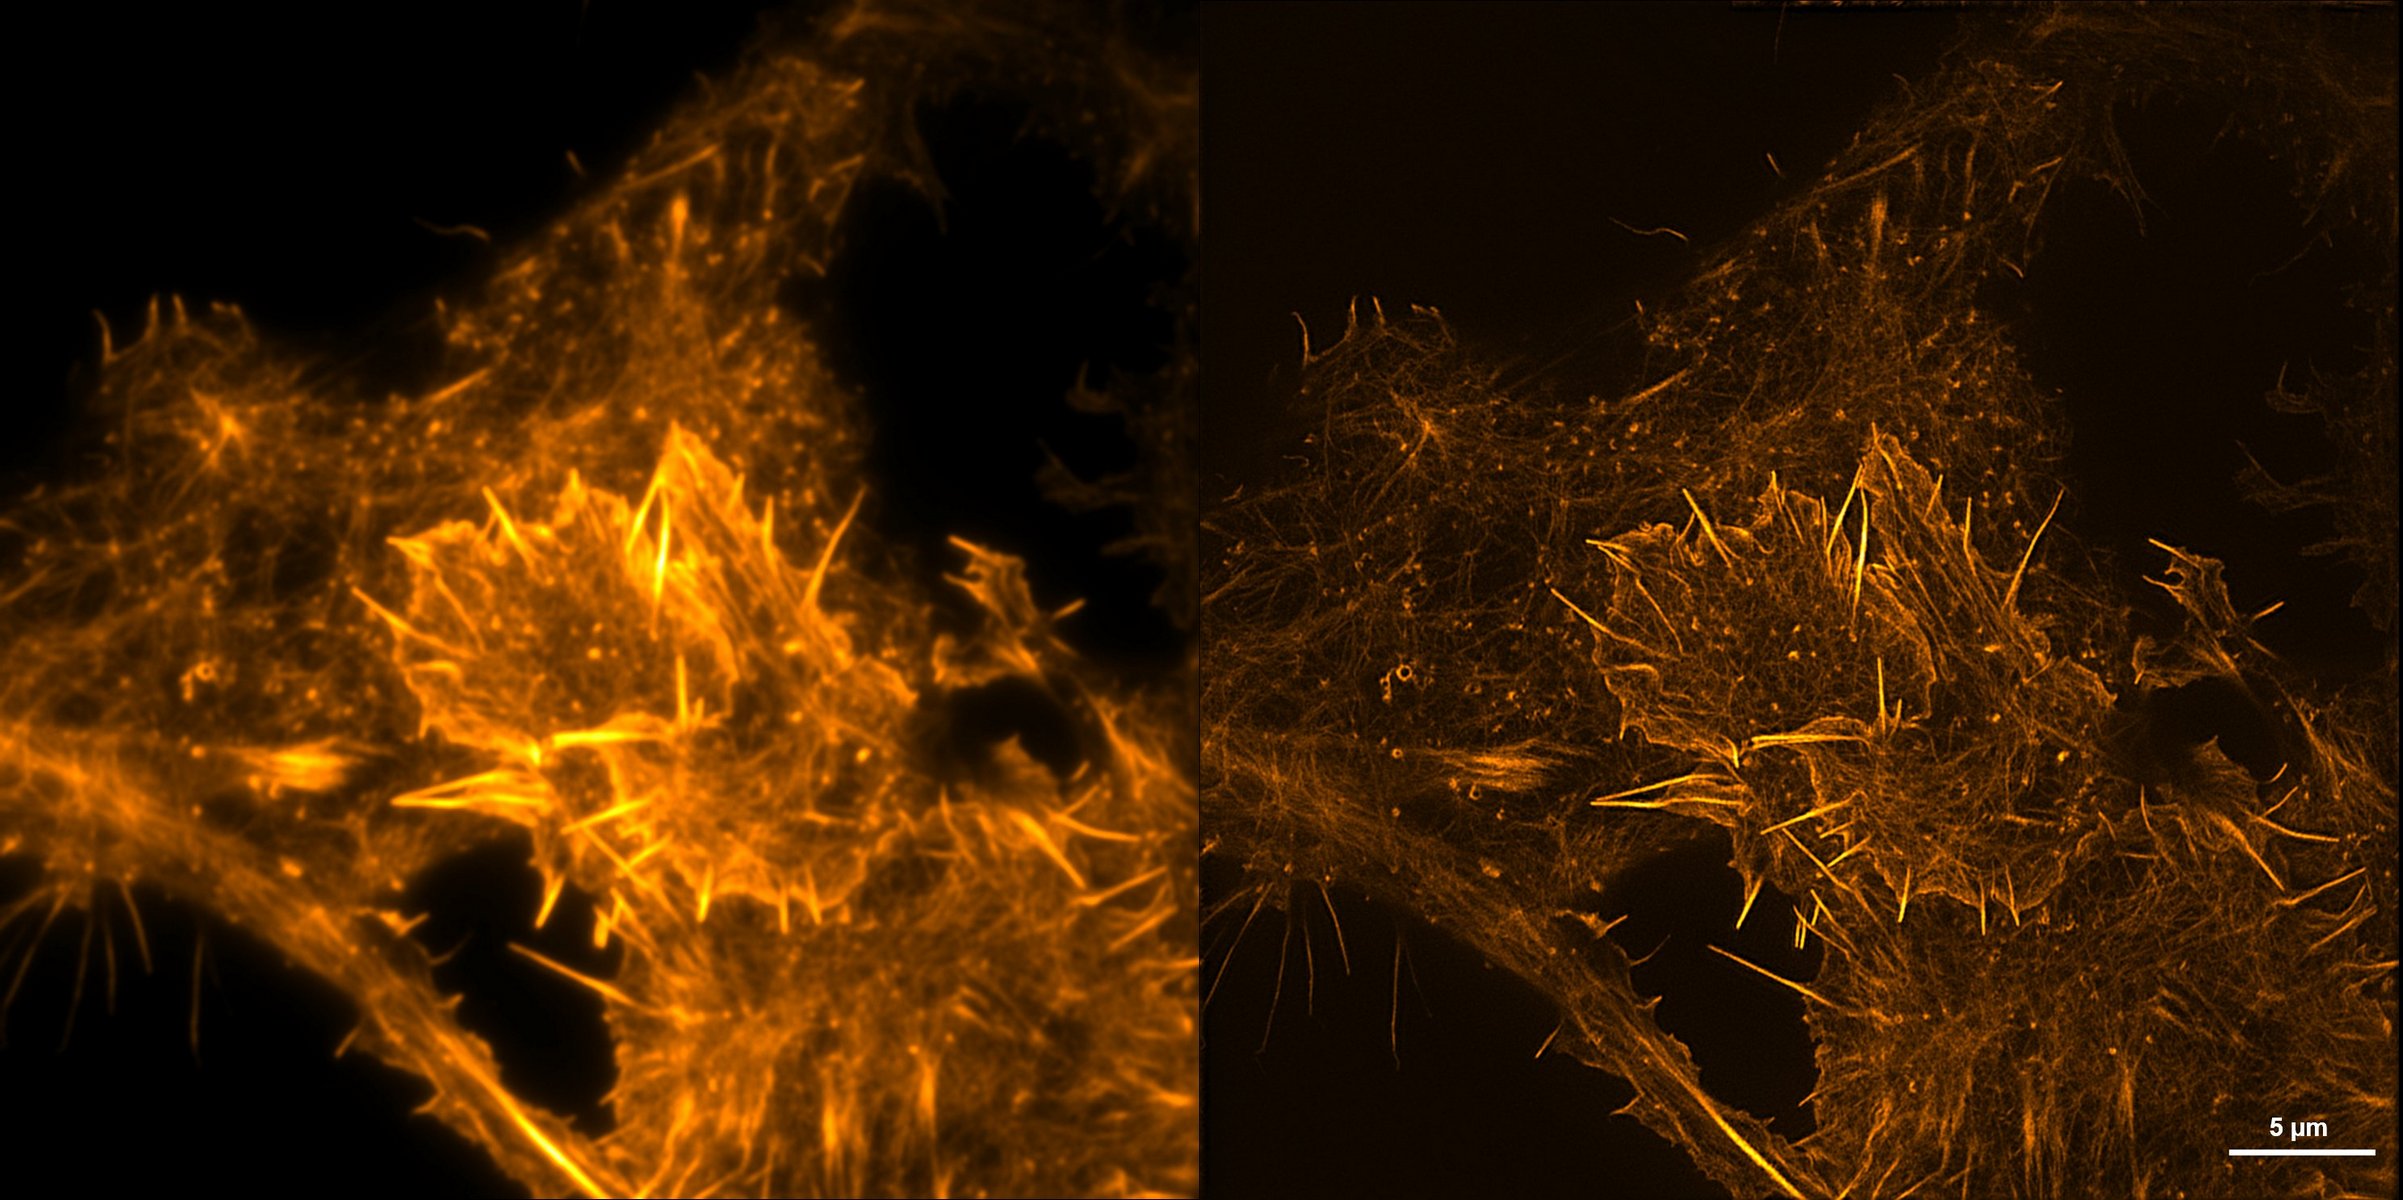
U2OS expressing LifeAct
Live U2OS cells expressing mNeonGreen-LifeAct labeled F-actin. Comparison of TIRF and TIRF-SIM. GE OMX SR; 60x/1.42 NA. Credit: Runwen Yao.
Live U2OS cells expressing mNeonGreen-LifeAct labeled F-actin. Comparison of TIRF and TIRF-SIM. GE OMX SR; 60x/1.42 NA. Credit: Runwen Yao.
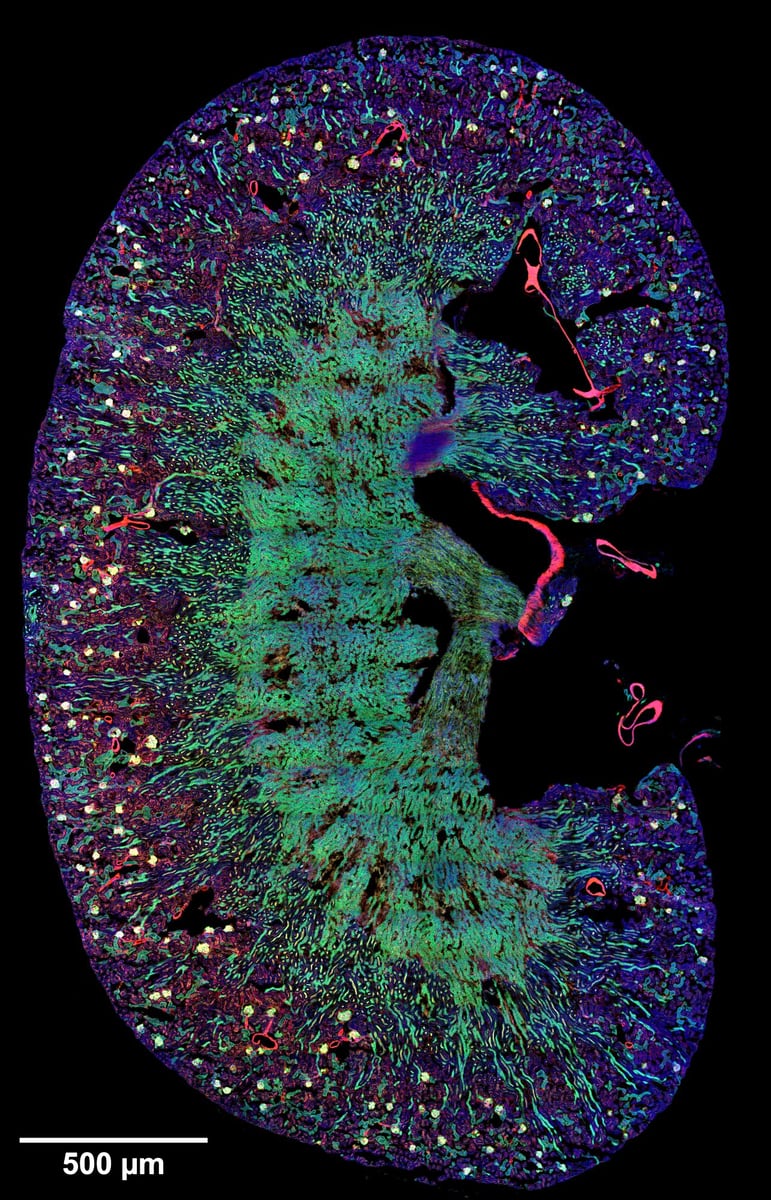
Mouse kidney – overview
Mouse kidney section stained with WGA-Alexa488, Phalloidin-Alexa561, and DAPI. Zeiss LSM 980 Airyscan 2; Plan-Apochromat 20x/0.8 NA; 342 stitched tiles. Credit: Marcel Mettlen.
Mouse kidney section stained with WGA-Alexa488, Phalloidin-Alexa561, and DAPI. Zeiss LSM 980 Airyscan 2; Plan-Apochromat 20x/0.8 NA; 342 stitched tiles. Credit: Marcel Mettlen.
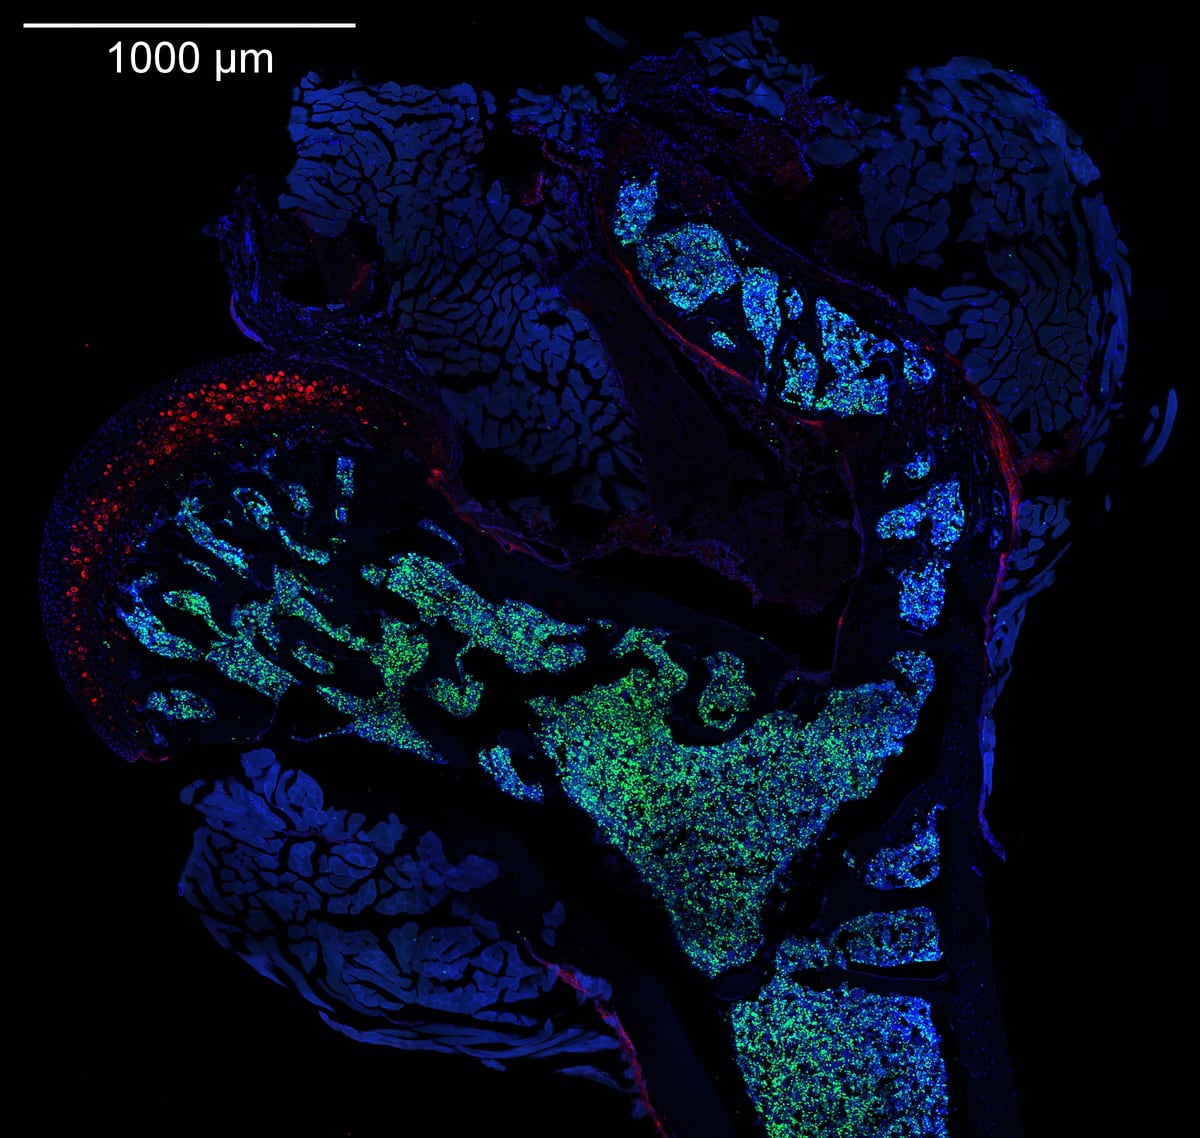
Murine femur section
Femur of a young adult mouse injected with EdU. Frozen section stained using Click-iT EdU 488 and anti-aggrecan antibody (CF555). Imaged on Nikon CSU-W1 spinning disk confocal microscope; 20x/0.75 NA. Credit: Jingzhu Zhang.
Femur of a young adult mouse injected with EdU. Frozen section stained using Click-iT EdU 488 and anti-aggrecan antibody (CF555). Imaged on Nikon CSU-W1 spinning disk confocal microscope; 20x/0.75 NA. Credit: Jingzhu Zhang.
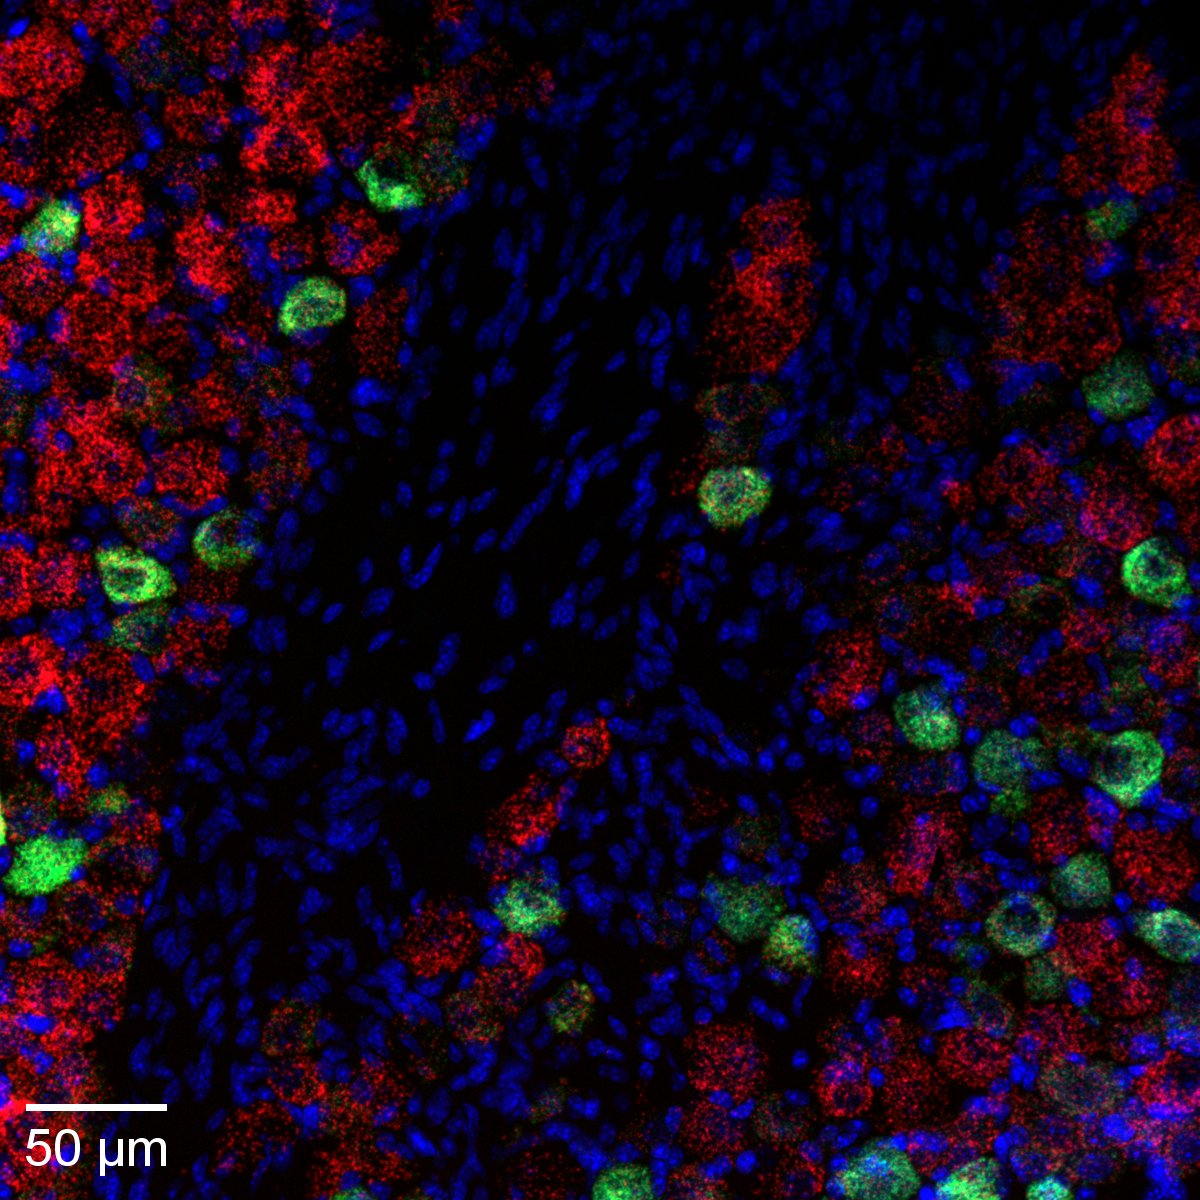
Mouse nodose ganglion
Fixed mouse nodose ganglion labeled with multiplex RNAscope for Phox2b (Opal 570), Cck1r (Opal 520), and DAPI. Zeiss LSM 880 Airyscan; 63x/1.4 NA. PMID: 34605820. Credit: Laurent Gautron.
Fixed mouse nodose ganglion labeled with multiplex RNAscope for Phox2b (Opal 570), Cck1r (Opal 520), and DAPI. Zeiss LSM 880 Airyscan; 63x/1.4 NA. PMID: 34605820. Credit: Laurent Gautron.
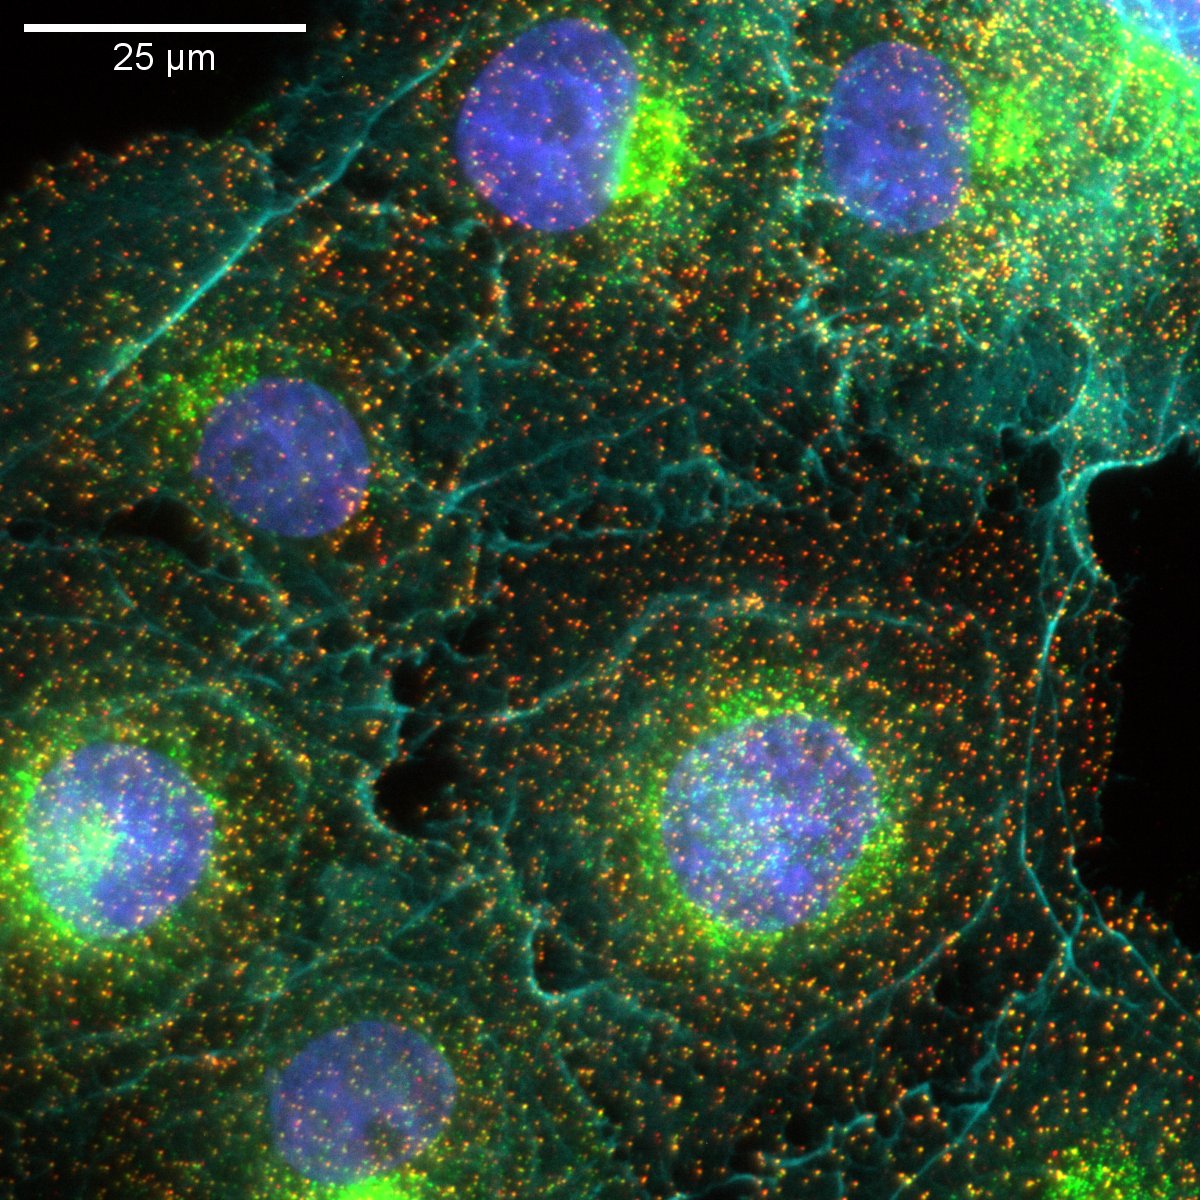
COS-7 cells
COS-7 cells labeled for clathrin light chain (Alexa488), AP2 (Alexa561), actin (phalloidin-Alexa640), and DAPI. Nikon Ti widefield; 100x/1.45 NA. Credit: Marcel Mettlen.
COS-7 cells labeled for clathrin light chain (Alexa488), AP2 (Alexa561), actin (phalloidin-Alexa640), and DAPI. Nikon Ti widefield; 100x/1.45 NA. Credit: Marcel Mettlen.