New interactive map first to show life expectancy of Texans by ZIP code, race, and gender
DALLAS – Feb. 27, 2019 – UT Southwestern Medical Center scientists for the first time have calculated and mapped life expectancy by gender and race/ethnicity down to the ZIP code and county levels in Texas.
The new analysis and interactive mapping tool, which uses data from the Texas Department of State Health Services (DSHS) Center for Health Statistics 2005-2014 death records, reveal dramatic variation by gender, race/ethnicity, and geography.
“We knew that where you live is predictive of health, but the degree of variation that we observed in this study was really striking, down to the ZIP code level,” said Dr. Sandi Pruitt, lead investigator of the new study and Assistant Professor in the Department of Population and Data Sciences at UT Southwestern.
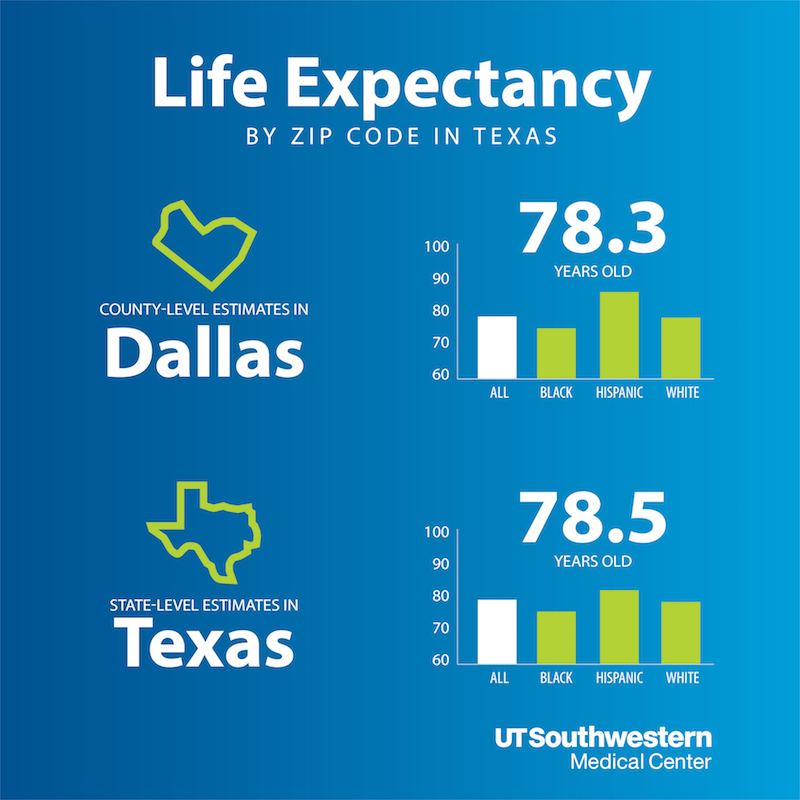
Life expectancy at birth is the average number of years that a newborn can expect to live assuming mortality patterns at the time of birth remain constant in the future. Overall life expectancy in Texas is 78.5 years, which means that on average a child born in Texas on Jan. 1, 2019, can expect to live until spring 2097.
Overall life average expectancy for women is 81.1 years compared with 75.9 for men. Life expectancy is 81.2 years for Hispanics, 78.1 years for whites, and 75.3 years for blacks.
“This study sheds important new light on the issue of health disparities,” said Dr. David Lakey, Vice Chancellor for Health Affairs for The University of Texas System. “Overall disparities by gender or racial groups are significant, but to truly impact health we need to understand where the disparities are most severe, and to recognize that there is immense geographic variation even within groups.”
Average life expectancy across gender and racial groups include:
- Hispanic women – 83.9 years; Hispanic men – 78.28
- White women – 80.6; White men – 75.6
- Black women – 78.0; Black men – 72.4
The online maps illustrate the variation in life expectancy occurring across geographic areas:
- Within Dallas County, for example, county-level life expectancy was 78.3 but ZIP code-level life expectancy ranged from 67.6 (75215) to 90.3 years (75204).
- Within Travis County (Austin area), county-level life expectancy was 82.0 but ZIP code-level life expectancy ranged from 75.2 (78721) to 87.5 years (78754).
- Within Harris County (Houston area), county-level life expectancy was 78.9 but ZIP code-level life expectancy ranged from 69.8 (77026) to 89.7 years (77073).
- Within El Paso County, county-level life expectancy was 79.8, but ZIP code-level life expectancy ranged from 75.6 (79901) to 90.4 years (79928).
- Within Bexar County (San Antonio area), county-level life expectancy was 79.1, but ZIP code-level life expectancy ranged from 67.6 (78208) to 89.2 years (78254).
- Within Tarrant County (Fort Worth area), county-level life expectancy was 78.7, but ZIP code-level life expectancy ranged from 66.7 (76104) to 87.2 years (76002).

A variety of groups may find the data mining capabilities valuable, including social services, government agencies, nonprofits, and even homeowners. The researchers examined 1.6 million death records to compile the database, focusing on the state’s three largest racial groups: non-Hispanic (NH) whites, blacks (regardless of ethnicity), and Hispanics. The database includes information on 992 ZIP codes in Texas.
Study limitations
The life expectancy data presented here have several limitations. Life expectancy is calculated with the assumption that mortality patterns remain constant over time, which is not necessarily true. Life expectancy in years is an estimate and reflects the average life expectancy for those living in a particular geographic area. Thus, few people will die at precisely the age indicated by life expectancy; some will die at younger ages and some will die at older ages. Life expectancy is a statistical measure that does not take into account any individual’s lifestyle behaviors or other factors that may contribute to an individual’s life span. Differences in life expectancy between geographic areas do not necessarily indicate that features of any particular area cause shorter or longer life expectancy; these differences may simply reflect differences in the characteristics of the residents in each community. The size of different communities in Texas varies greatly. In general, life expectancy estimates calculated for larger populations may be more stable than those calculated for smaller populations. Finally, the associations observed between socioeconomic factors, race/ethnicity, and life expectancy are not necessarily causal. Individuals of any race/ethnicity or socioeconomic strata may live longer or shorter lives, based on many factors. Despite these limitations, these data demonstrate average differences in life expectancy for communities across Texas. The results can be used to inform and empower future policies and interventions designed to maximize the well-being for all Texans.
About UT Southwestern Medical Center
UT Southwestern, one of the premier academic medical centers in the nation, integrates pioneering biomedical research with exceptional clinical care and education. The institution’s faculty has received six Nobel Prizes, and includes 22 members of the National Academy of Sciences, 17 members of the National Academy of Medicine, and 15 Howard Hughes Medical Institute Investigators. The full-time faculty of more than 2,500 is responsible for groundbreaking medical advances and is committed to translating science-driven research quickly to new clinical treatments. UT Southwestern physicians provide care in about 80 specialties to more than 105,000 hospitalized patients, nearly 370,000 emergency room cases, and oversee approximately 3 million outpatient visits a year.