
MRI
Here is a sample of MRI images from the Small Animal Imaging Resource (UT-SAIR) at UT Southwestern.
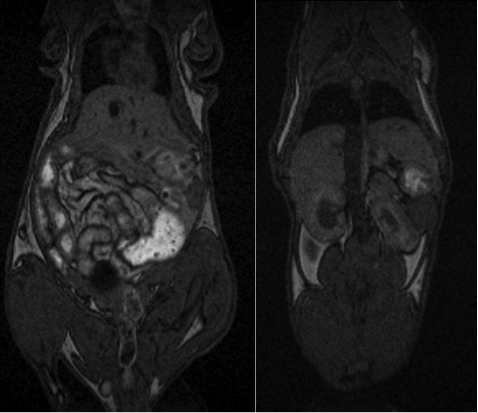
T 1-weighted MRI acquired on the 1T ASPECT MRI: T 1-weighted scans refer to a set of standard scans that depict differences in the spin-lattice (or T 1) relaxation time of various tissues within the body (different coronal slices). T 1 weighted images can be acquired using either spin echo or gradient-echo sequences. T 1-weighted contrast can be increased with the application of an inversion recovery RF pulse. Gradient-echo based T 1-weighted sequences can be acquired very rapidly because of their ability to use short inter-pulse repetition times (TR). T 1-weighted sequences are often collected before and after infusion of T 1-shortening MRI contrast agents. In the brain T 1-weighted scans provide appreciable contrast between gray and white matter. In the body, T1 weighted scans work well for differentiating fat from water – with water appearing darker and fat brighter.
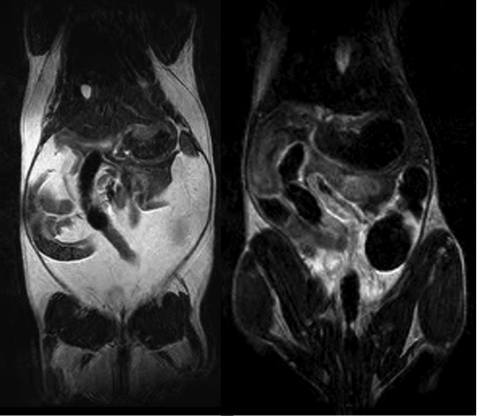
T 2-weighted MRI acquired on the 1T ASPECT MRI: T 2-weighted scans refer to a set of standard scans that depict differences in the spin-spin (or T 2) relaxation time of various tissues within the body (different coronal slices). Like the T 1-weighted scan, fat is differentiated from water, but in this case fat shows darker and water lighter. For example, in the case of cerebral and spinal study, the cerebrospinal fluid will be lighter in T 2-weighted images. These scans are therefore particularly well suited to imaging edema, with long TE and long TR. Because the spin echo sequence is less susceptible to inhomogeneities in the magnetic field, these images have long been a clinical workhorse.
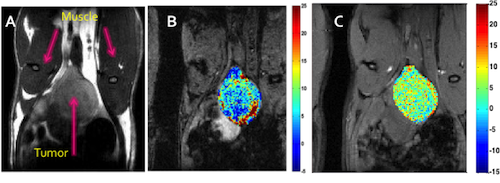
Oxygen-enhanced MRI in orthotopic PC3 prostate tumor xenograft in nude rat (images were obtained at 4.7T Agilent MRI Scanner): A) High resolution image illustrating the detection of the orthotopic prostate tumor (coronal slice); B) BOLD (Blood Oxygen Level Dependent) contrast dynamics (T 2*-weighted percentage signal response map) to oxygen breathing challenge; C) TOLD (Tissue Oxygen Level Dependent) dynamics (T 1-weighted percentage signal response map). Data acquired in association with Biomedical Engineering Graduate Student Derek White, supported by R01 CA139043.
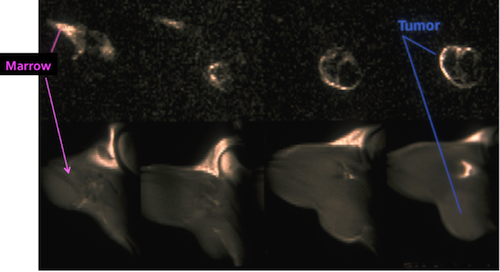
Combined 19F and 1H MRI of rat at 4.7T Agilent MRI scanner. Lower: 1H multislice MRI of Novikoff hepatoma in thigh of rat. Upper: Corresponding 19F MRI of sequestered perfluorocarbon emulsion in the bone marrow and around the periphery of this multinodular tumor (image resolution 470 x 300 μm with 5 mm slice thickness) (Modified from Curr. Med. Chem. 12 (7) 819-848 (2005)).
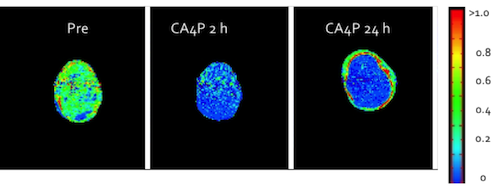
Dynamic 4.7T Agilent Contrast-Enhanced Magnetic Resonance Imaging (DCE-MRI): Series of T 1-weighted contrast-enhanced images of 13762NF rat breast carcinoma were acquired pre, and 2 hours and 24 hours after treatment with CA4P (30 mg/kg times with respect to infusion of bolus injection of contrast agent. Normalized cross-sectional images of signal enhancement 23 seconds after contrast agent administration shown for representative tumor. Significantly less signal enhancement was observed for whole tumor region 2 hours after treatment. Full recovery is apparent in tumor rim 24 hours after treatment. (Modified from Int. J. Radiation Oncology Biol. Phys., Vol. 62, No. 3, pp. 872–880, 2005; doi:10.1016/j.ijrobp.2005.03.009)
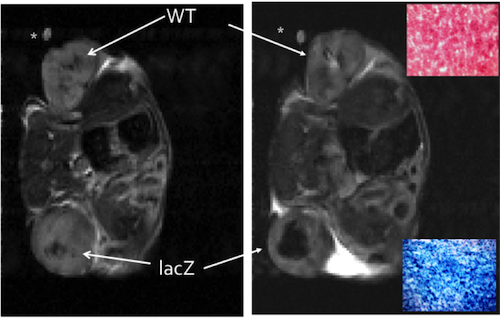
MRI detection of enzyme activity (obtained on 4.7T Agilent MRI Scanner): Wild type and stably transfected β-galactosidase expressing breast tumors were implanted in thighs of mouse. Transaxial T2-weighted MR images were acquired using spin echo sequence (TR = 1 s, TE = 40 ms, 310 * 390 mm in-plane resolution with 2 mm slice thickness). Arrows indicate lacZ and WT tumors. * Indicates capillary phantom. Left: Before injection of contrast agent; WT: WT MCF tumor; LacZ: lacZ-transfected MCF7 tumor. Right: Immediately (greater than 5 minutes) after intratumoral injection of enzyme activatable contrast agent S-Gal and ferric ammonium citrate FAC, showing strong hypointense contrast in lacZ tumor. Histology of tumor slices confirmed β-gal expression in lacZ tumor shown by 4-chloro-3-bromoindole-galactose stain (blue) with pink nuclear fast counter stain, but WT tumor. (Modified from “S-Gal®, A Novel 1H MRI Reporter for β-Galactosidase” W. Cui, L. Liu, V. D. Kodibagkar, R. P. Mason, Magn. Reson. Med. Online May 64:65–71, 2010 (DOI 10.1002/mrm.22400)
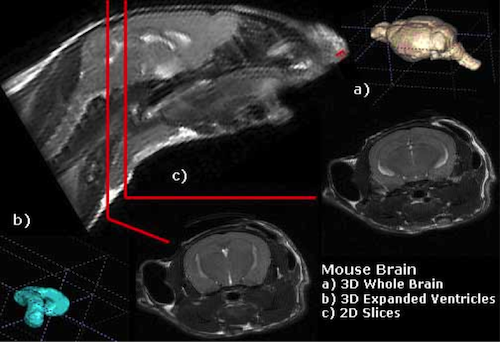
Representative T 2WI images of a mouse brain acquired using 7.0T Agilent MRI scanner. Note the bright CSF in the ventricles. A 3D volume rendering of the mouse brain is shown in the upper right.
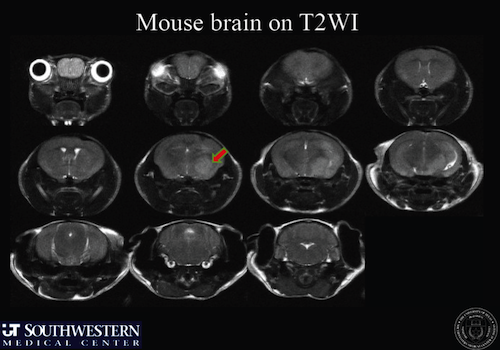
Representative T 2WI images of a mouse brain tumor acquired using 7.0T Agilent MRI Scanner. Note the visualization of the tumor (red arrow) on the axial scans.

Representative T 2WI images showing longitudinal images of a mouse model of hepatic tumor. In 3 weeks, the liver tumor grew from nonvisible (left) into ca. 1.2-2.3 mm in diameter (right, red arrows). The images were acquired using 7.0T Agilent MRI scanner, with major parameters of TR = 2500 ms, TE = 40 ms, Average = 8, Slice Number = 17, Matrix Size = 256x256, Slice Thickness = 1 mm, Field of View = 30 x 30 mm, with a 6 ms fatsat to suppress the fat signal, under respiratory gating.
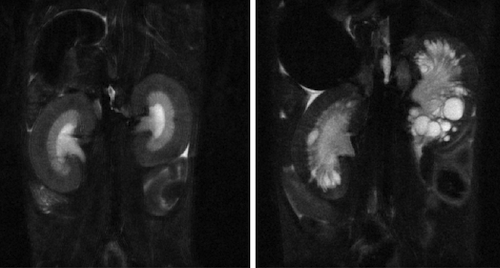
Representative T 2WI images of mouse kidneys: Normal (left) vs. Polycystic Disease Kidney (right) at the same age of two months. The images were acquired using 7.0T Agilent MRI scanner using Fast Spin Echo sequence with major parameters: TR = 2500 ms, TE = 60 ms, Average = 6, Matrix Size = 256x256, Slice Thickness = 1 mm, Field of View = 25.6 x 25.6 mm.
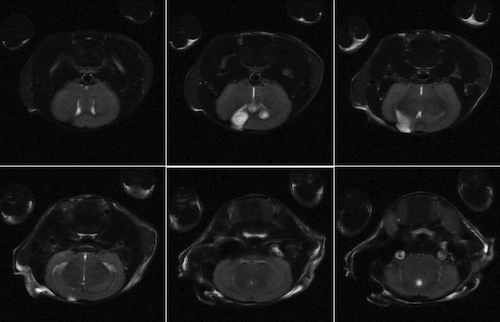
Representative T2WI images of a mouse model of traumatic brain injury (TBI): The images were acquired using 7.0T Agilent MRI scanner using a fast spin echo sequence with major parameters: TR = 2500 ms, TE = 60 ms, Average = 6, Matrix Size = 256x256, Slice Thickness = 1 mm, Slice Number = 15, Field of View = 25.6 x 25.6 mm.
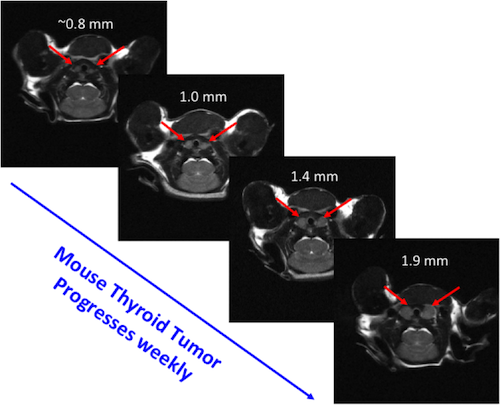
Representative T2WI images showing progressive size changes of thyroid tumors in a mouse model of thyroid cancer: The images were acquired using 7.0T Agilent MRI scanner using a fast spin echo sequence with major parameters: TR = 2500 ms, TE = 60 ms, Average = 6, Matrix Size = 256x256, Slice Thickness = 1 mm, Slice Number = 15, Field of View = 25.6 x 25.6 mm.
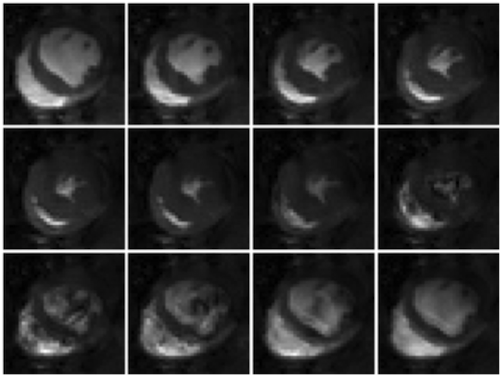
Representative rat cardiac images (axial view) cropped to focus on the rat heart: The images were acquired on 9.4T Agilent MRI scanner equipped with a homemade surface coil (55 mm diameter) using tagcine sequence with RR ~ 200 ms, 12 frame per RR, flip angle 45, 6 average, 64x64 mm field of view, 2 mm slice thickness, 128x128 matrix size under ECG triggering and respiratory gating.
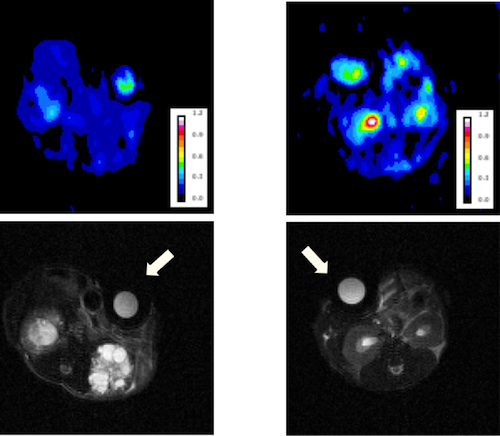
1H (lower) and 23Na (upper, pseudo-color) images of a mouse kidney, polycystic disease kidney (PKD) on the left vs. a normal control on the right. The external tube (arrow) is the same one containing 100 mM NaCl solution. 23Na images clearly showed that PKD mouse has lower 23Na signal intensity in kidney. The images were acquired on 9.4T Agilent MRI scanner.
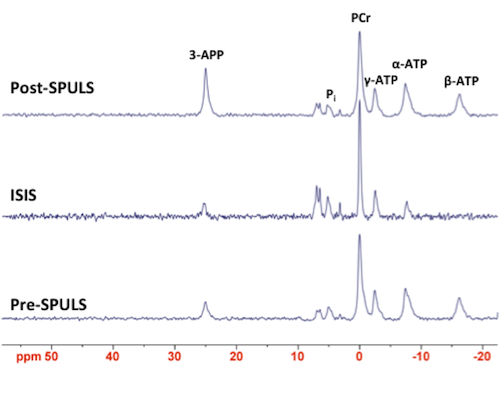
31P MRS of a flank tumor model using 3-aminopropylphosphonic acid (3-APP) as an extracellular pH tracer. The 31P spectra were acquired on 9.4T Agilent MRI scanner equipped with a 20 mm surface 31P coil sitting right on top of tumor and a 38 mm 1H quad volume coil for shimming and finding the anatomical position. The localized 31P spectrum (middle) was recorded using ISIS sequence, voxel size = 9x13x7 mm^ 3, TR = 5 s, number of point = 512, spectral width = 13K, and 512 average. The 3-APP was injected via i.p. 50 ul at concentration of 100mg/ml. The measured extracellular and intracellular pH values are pH e = 6.52 (from 3-APP signal) and pH i = 7.30 (from inorganic P i signal), respectively.